Williams %R điều chỉnh động chiến lược dừng lỗ và dừng lãi

Tổng quan
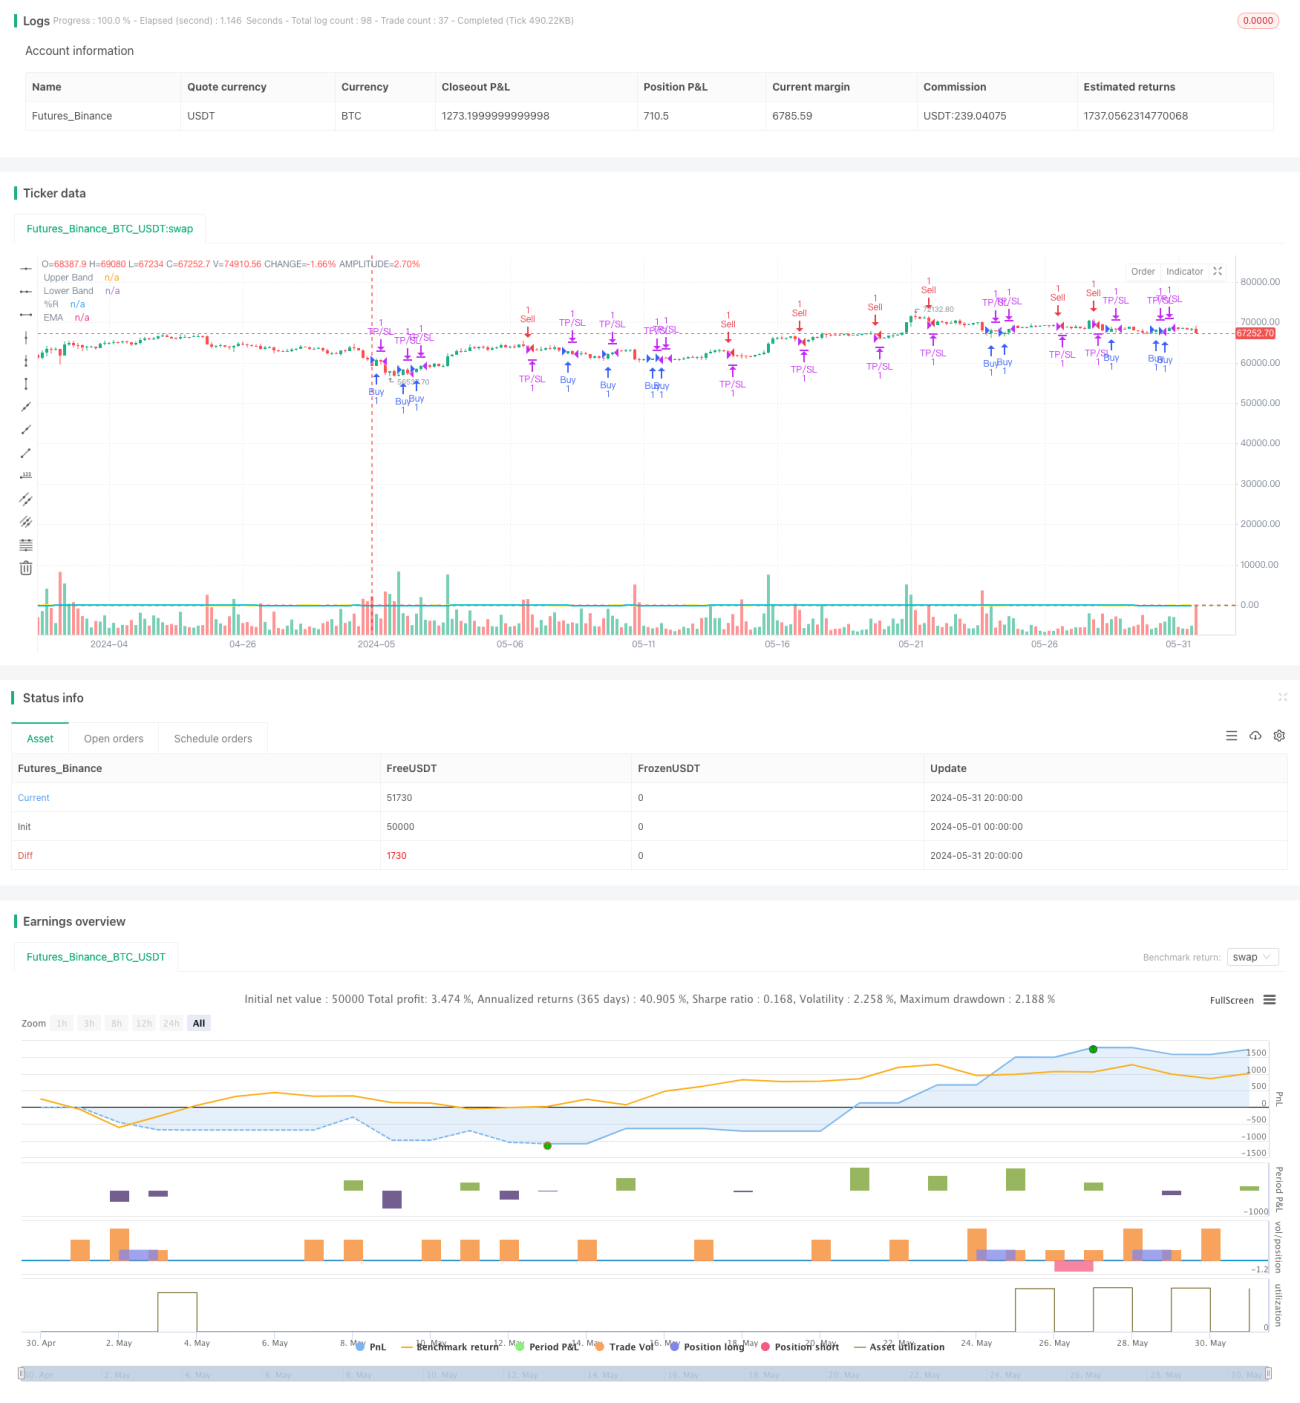
Chiến lược này dựa trên chỉ số Williams %R, để tối ưu hóa hiệu suất giao dịch bằng cách điều chỉnh động mức dừng lỗ. Nó tạo ra tín hiệu mua khi Williams %R đi qua vùng Bán quá mức (−80) và tạo ra tín hiệu bán khi đi qua vùng Bán quá mức (−20). Đồng thời sử dụng chỉ số di chuyển trung bình (EMA) để làm mịn giá trị Williams %R để giảm tiếng ồn.
Nguyên tắc chiến lược
- Tính giá trị chỉ số Williams %R cho một chu kỳ.
- Tính toán chỉ số di chuyển trung bình của Williams %R (EMA) [2].
- Khi Williams %R từ dưới lên vượt qua mức 80, kích hoạt tín hiệu mua; từ trên xuống vượt qua mức 20, kích hoạt tín hiệu bán.
- Sau khi mua, đặt mức dừng và dừng để thanh toán cho đến khi đạt được giá dừng / dừng hoặc Williams % R kích hoạt tín hiệu đảo ngược.
- Sau khi bán, thiết lập mức dừng và dừng lỗ và thanh toán cho đến khi đạt được giá dừng / dừng lỗ hoặc Williams % R kích hoạt tín hiệu đảo ngược.
- Có thể chọn giao dịch trong phạm vi thời gian được chỉ định (ví dụ: 9: 00-11: 00) và có giao dịch gần điểm nguyên (từ X phút trước đến Y phút sau).
- Các hướng giao dịch có thể được chọn là chỉ giao dịch nhiều, chỉ giao dịch ngắn hoặc giao dịch hai chiều.
Phân tích lợi thế
- Động thái dừng lỗ: Động thái điều chỉnh mức dừng lỗ theo cài đặt của người dùng, để bảo vệ lợi nhuận và kiểm soát rủi ro tốt hơn.
- Các tham số linh hoạt: Người dùng có thể đặt các tham số khác nhau theo sở thích của mình, chẳng hạn như chu kỳ chỉ số, mức dừng lỗ, thời gian giao dịch, để thích ứng với các điều kiện thị trường khác nhau.
- Chỉ số mịn: giới thiệu số EMA mịn Williams % R, có thể làm giảm hiệu quả tiếng ồn chỉ số và cải thiện độ tin cậy tín hiệu.
- Hạn chế thời gian giao dịch: Có thể chọn giao dịch trong một khoảng thời gian nhất định, tránh thời gian thị trường biến động lớn, giảm rủi ro.
- Định hướng giao dịch tùy chỉnh: tùy thuộc vào xu hướng thị trường và sự phán đoán cá nhân, bạn có thể chọn chỉ giao dịch nhiều, chỉ giao dịch ngắn hoặc giao dịch hai chiều.
Phân tích rủi ro
- Thiết lập tham số không đúng: Nếu thiết lập dừng lỗ quá lỏng lẻo hoặc quá nghiêm ngặt, có thể dẫn đến mất lợi nhuận hoặc dừng lỗ thường xuyên.
- Lỗi nhận dạng xu hướng: Chỉ số Williams %R hoạt động kém trong thị trường chấn động, có thể tạo ra tín hiệu sai.
- Giới hạn thời gian có hiệu quả hạn chế: Giới hạn thời gian giao dịch có thể khiến chiến lược bỏ lỡ một số cơ hội giao dịch tốt.
- Tối ưu hóa quá mức: Các tham số tối ưu hóa quá mức có thể dẫn đến chiến lược không hoạt động tốt trong giao dịch thực tế trong tương lai.
Hướng tối ưu hóa
- Kết hợp với các chỉ số khác: như chỉ số xu hướng, chỉ số dao động, v.v. để tăng độ chính xác xác nhận tín hiệu.
- Tối ưu hóa tham số động: Điều chỉnh tham số theo thời gian thực theo tình trạng thị trường, chẳng hạn như sử dụng các thiết lập tham số khác nhau trong thị trường xu hướng và thị trường chấn động.
- Cải thiện phương pháp dừng lỗ: sử dụng các phương pháp như dừng theo dõi, dừng một phần để bảo vệ lợi nhuận và kiểm soát rủi ro tốt hơn.
- Tham gia quản lý tiền: Đổi đổi kích thước vị trí của mỗi giao dịch theo số dư tài khoản và sở thích rủi ro.
Tóm tắt
Chiến lược dừng lỗ động của Williams % R nắm bắt tình trạng quá mua và quá bán của giá bằng cách đơn giản và hiệu quả, đồng thời cung cấp các thiết lập tham số linh hoạt để phù hợp với các môi trường thị trường và phong cách giao dịch khác nhau. Chiến lược này điều chỉnh động mức dừng lỗ để kiểm soát rủi ro và bảo vệ lợi nhuận tốt hơn. Tuy nhiên, trong ứng dụng thực tế, vẫn cần chú ý đến các yếu tố như thiết lập tham số, xác nhận tín hiệu, lựa chọn thời gian giao dịch để tiếp tục cải thiện sự ổn định và khả năng sinh lợi của chiến lược.
- 1