Chiến lược giao dịch định lượng dựa trên mô hình đảo ngược hỗ trợ và kháng cự

Tổng quan
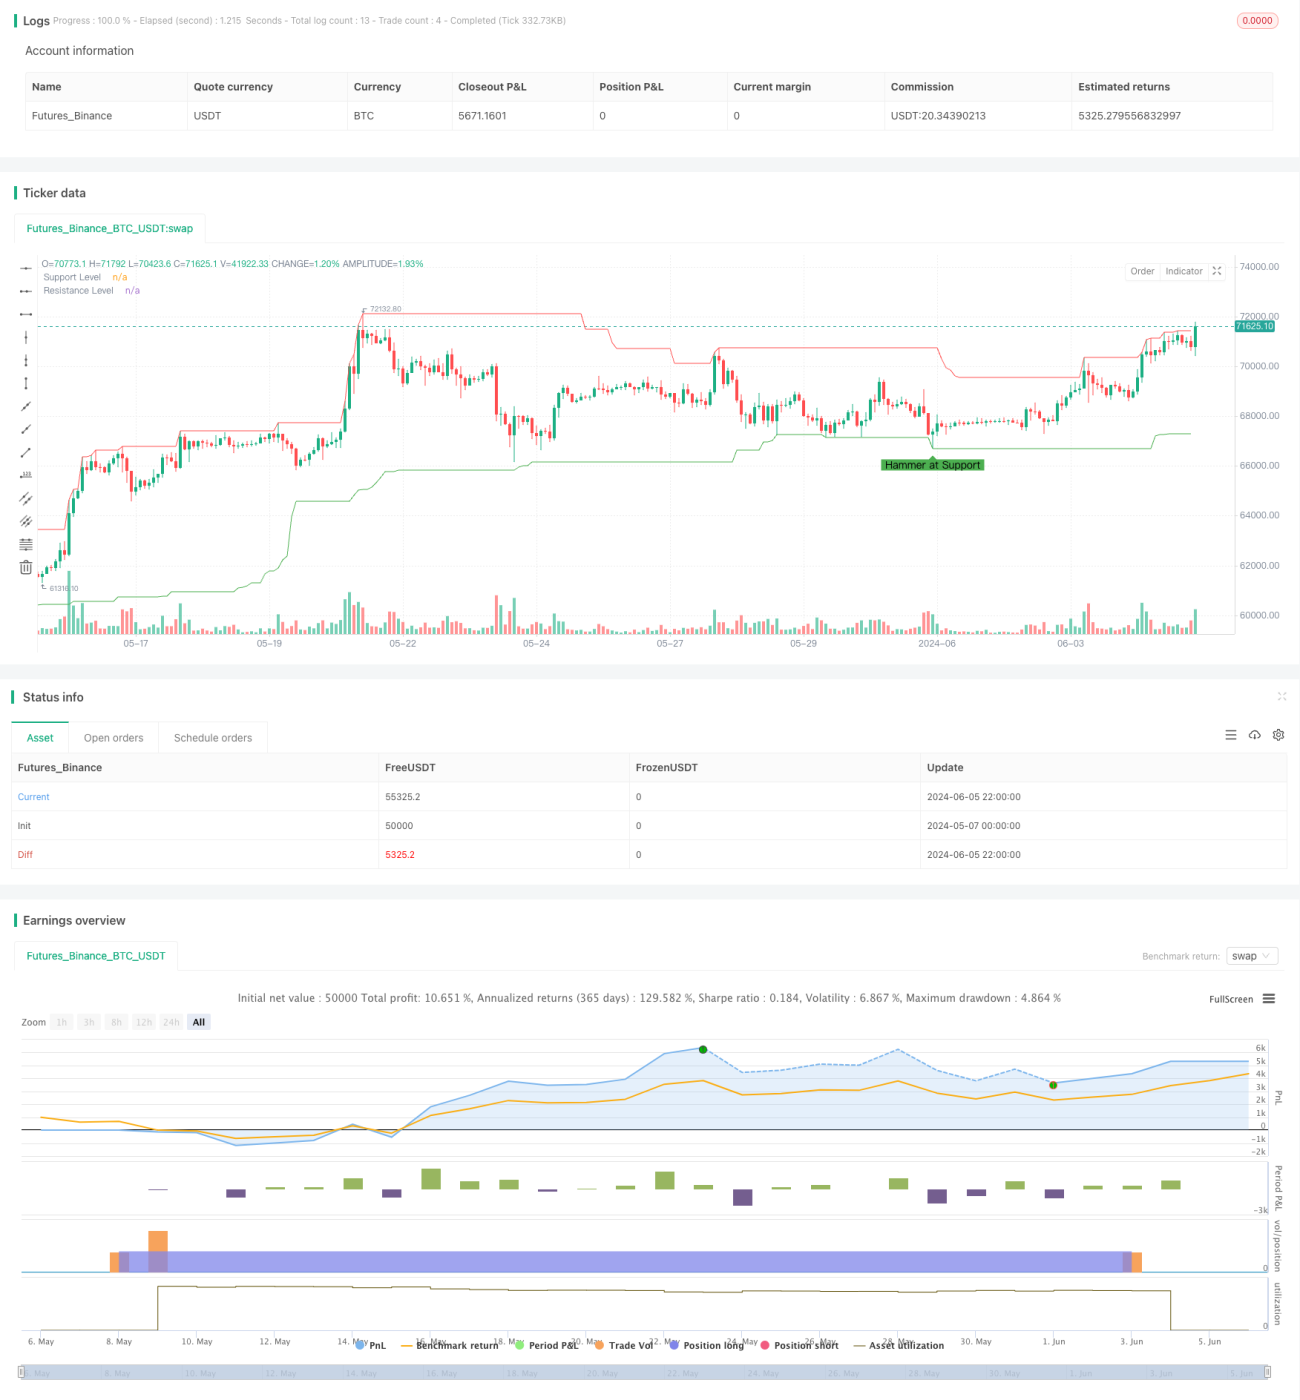
Chiến lược này dựa trên các hình thức đảo ngược trong phân tích kỹ thuật (đường trục, hình thức nuốt và ngôi sao) và các vị trí hỗ trợ và kháng cự, giao dịch trên biểu đồ 1 giờ. Chiến lược này thực hiện giao dịch bằng cách xác định các điểm đảo ngược thị trường tiềm năng và các mức dừng và dừng lỗ dự kiến.
Ý tưởng chính của chiến lược này là mở nhiều vị trí khi có hình thức đảo ngược bullish gần vị trí hỗ trợ (như đường nét, hình thức nuốt bullish hoặc hình ảnh thập giá) và mở vị trí trống khi có hình thức đảo ngược bullish gần vị trí kháng cự (như đường nét, hình thức nuốt bullish hoặc hình ảnh thập giá). Đồng thời thiết lập mức dừng và dừng để kiểm soát rủi ro và khóa lợi nhuận.
Nguyên tắc chiến lược
- Sử dụng hàm ta.lowest() và ta.highest() để tính toán giá thấp nhất và giá cao nhất trong thời gian dự kiến được chỉ định, xác định mức hỗ trợ và mức kháng cự.
- Xác định xem bản đồ hiện tại có hình thành đường trục, hình dạng nuốt hoặc hình chữ thập không.
- Nếu gần mức hỗ trợ, bạn có thể mở nhiều vị trí. Nếu gần mức kháng cự, bạn có thể mở một vị trí trống.
- Thiết lập giá dừng là 3% giá mở và giá dừng là 1% giá mở.
- Khi giá đạt đến mức dừng hoặc dừng lỗ, bạn sẽ phá vỡ.
Lợi thế chiến lược
- Kết hợp với hình thức đảo ngược và ngưỡng kháng cự hỗ trợ quan trọng, tăng độ tin cậy của tín hiệu giao dịch.
- Thiết lập các mức dừng và dừng rõ ràng để kiểm soát rủi ro hiệu quả.
- Nó có thể được sử dụng cho cả thị trường đang có xu hướng và thị trường đang có biến động để nắm bắt cơ hội đảo ngược tiềm năng.
- Mã đơn giản, dễ hiểu và dễ thực hiện.
Rủi ro chiến lược
- Trong một thị trường bất ổn, các tín hiệu đảo ngược thường xuyên xảy ra, có thể dẫn đến giao dịch quá mức và mất phí.
- Việc đánh giá mức hỗ trợ và kháng cự phụ thuộc vào lựa chọn thời gian dự kiến, thời gian dự kiến khác nhau có thể dẫn đến kết quả khác nhau.
- Sự tin cậy của hình thức đảo ngược không phải là tuyệt đối, tín hiệu sai có thể gây thiệt hại.
Giải pháp:
- Giảm tín hiệu giả bằng cách điều chỉnh các tham số và điều kiện xác nhận của hình dạng đảo ngược.
- Kết hợp với các chỉ số kỹ thuật khác hoặc chỉ số cảm xúc thị trường, tăng độ tin cậy của tín hiệu.
- Điều chỉnh mức dừng và mất mát thích hợp để đối phó với các tình huống thị trường khác nhau.
Hướng tối ưu hóa chiến lược
- Tiếp tục giới thiệu các chỉ số khối lượng giao dịch để xác nhận tính hiệu quả của mô hình đảo ngược. Mô hình đảo ngược có khối lượng giao dịch cao có thể đáng tin cậy hơn.
- Cân nhắc các điểm kháng cự hỗ trợ trong nhiều khung thời gian để tăng độ chính xác của các điểm kháng cự hỗ trợ.
- Kết hợp các chỉ số xu hướng, như trung bình di chuyển, để giao dịch theo xu hướng và tránh giao dịch ngược.
- Tối ưu hóa mức dừng và mất mát, điều chỉnh theo động thái biến động của thị trường để có được tỷ lệ lợi nhuận rủi ro tốt hơn.
Tóm tắt
Chiến lược này nắm bắt các cơ hội giao dịch tiềm năng bằng cách xác định các hình thức đảo ngược gần mức hỗ trợ và kháng cự. Nó đơn giản, dễ sử dụng và phù hợp với các môi trường thị trường khác nhau. Tuy nhiên, sự thành công của chiến lược phụ thuộc vào việc đánh giá chính xác các hình thức đảo ngược và kháng cự hỗ trợ.
/*backtest
start: 2024-05-07 00:00:00
end: 2024-06-06 00:00:00
period: 2h
basePeriod: 15m
exchanges: [{"eid":"Futures_Binance","currency":"BTC_USDT"}]
*/

// This Pine Script™ code is subject to the terms of the Mozilla Public License 2.0 at https://mozilla.org/MPL/2.0/
// © Kingcoinmilioner

//@version=5- 1