Chiến lược xu hướng RSI

Tổng quan
Chiến lược này dựa trên chỉ số tương đối mạnh (RSI) để xác định các tín hiệu mua và bán bằng cách đánh giá xem giá trị của chỉ số RSI có vượt quá mức giảm hoặc giảm dự kiến hay không. Đồng thời, chiến lược này cũng đặt giới hạn thời gian dừng lỗ và giữ vị trí để kiểm soát rủi ro.
Nguyên tắc chiến lược
- Tính toán giá trị của chỉ số RSI
- Một tín hiệu mua được tạo ra khi giá trị RSI thấp hơn ngưỡng mua mặc định; một tín hiệu bán được tạo ra khi giá trị RSI cao hơn ngưỡng bán mặc định.
- Theo tín hiệu mua, số lượng mua được tính bằng giá đóng cửa hiện tại và đặt mua.
- Nếu bạn đặt tỷ lệ dừng lỗ, hãy tính giá dừng lỗ và đặt lệnh dừng lỗ.
- Theo các tín hiệu bán hoặc các điều kiện dừng lỗ, tất cả các vị trí giữ lệnh đều được giữ ở vị trí bình thường.
- Nếu thiết lập thời gian giữ tối đa, sau khi thời gian giữ vượt quá thời gian giữ tối đa, tất cả các vị trí giữ đều được thanh toán, bất kể lợi nhuận hay thua lỗ.
Lợi thế chiến lược
- Chỉ số RSI là một chỉ số phân tích kỹ thuật được sử dụng rộng rãi, có khả năng nắm bắt hiệu quả các tín hiệu quá mua và quá bán của thị trường.
- Chiến lược này giới thiệu các giới hạn về thời gian giữ và dừng lỗ, giúp kiểm soát rủi ro.
- Chiến lược này có logic rõ ràng, dễ hiểu và dễ thực hiện.
- Điều chỉnh các tham số và ngưỡng của RSI để thích ứng với các môi trường thị trường khác nhau.
Rủi ro chiến lược
- Chỉ số RSI có thể phát tín hiệu sai trong một số trường hợp, dẫn đến tổn thất trong chiến lược.
- Chiến lược này không xem xét các yếu tố cơ bản của các loại giao dịch và chỉ dựa vào các chỉ số kỹ thuật, có thể có nguy cơ đối mặt với sự kiện bất ngờ của thị trường.
- Tỷ lệ dừng cố định có thể không thích nghi với sự biến động của thị trường.
- Hiệu suất của chiến lược có thể bị ảnh hưởng bởi cài đặt tham số, tham số không phù hợp có thể dẫn đến hiệu suất của chiến lược kém.
Hướng tối ưu hóa chiến lược
- Các chỉ số kỹ thuật khác, chẳng hạn như đường trung bình di chuyển, được đưa vào để tăng độ tin cậy của chiến lược.
- Tối ưu hóa các chiến lược dừng lỗ, chẳng hạn như sử dụng dừng di chuyển hoặc dừng động dựa trên biến động.
- Các tham số và ngưỡng RSI được điều chỉnh động theo tình hình thị trường.
- Kết hợp các phân tích cơ bản về các loại giao dịch để cải thiện khả năng kiểm soát rủi ro của chiến lược.
- Phản hồi và tối ưu hóa tham số cho chiến lược để tìm ra sự kết hợp tham số tốt nhất.
Tóm tắt
Chiến lược này sử dụng các chỉ số RSI để nắm bắt các tín hiệu quá mua và quá bán của thị trường, đồng thời giới thiệu các giới hạn thời gian dừng lỗ và giữ vị trí để kiểm soát rủi ro. Logic của chiến lược đơn giản, dễ thực hiện và tối ưu hóa. Tuy nhiên, hiệu suất của chiến lược có thể bị ảnh hưởng bởi biến động thị trường và cài đặt tham số, do đó cần kết hợp với các phương pháp phân tích khác và các phương tiện quản lý rủi ro để tăng cường sự ổn định và lợi nhuận của chiến lược.
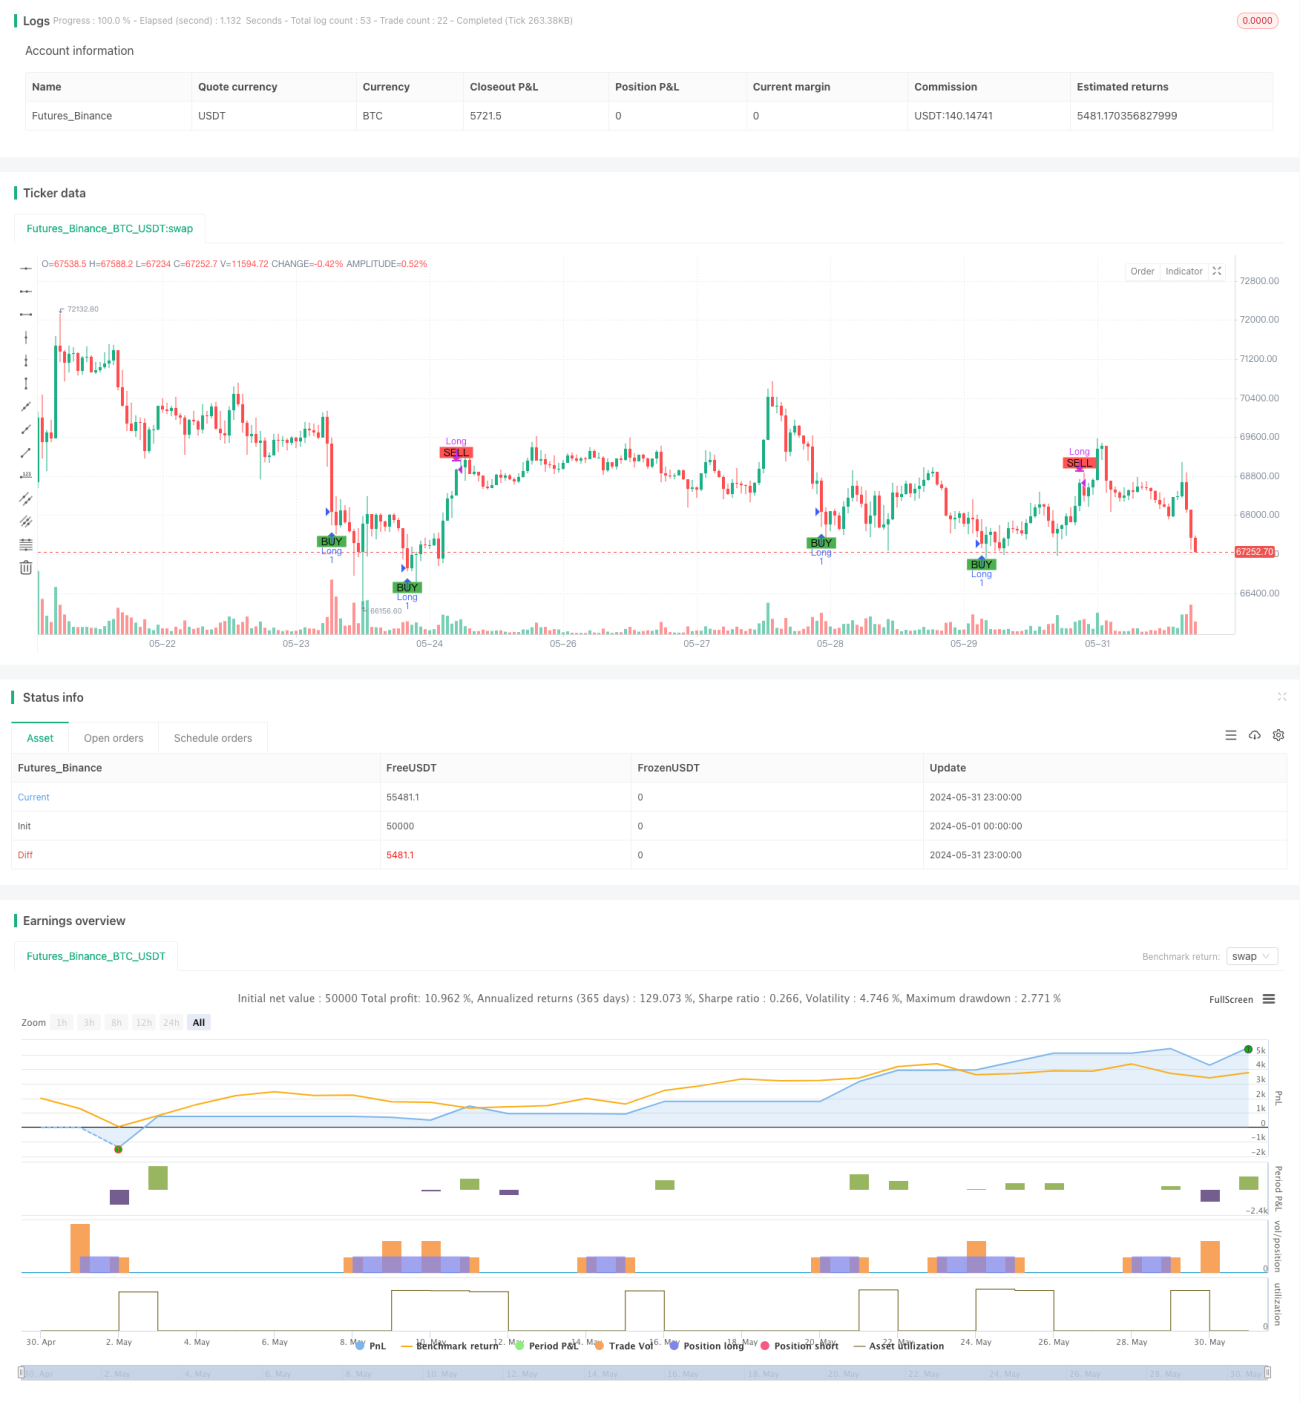
/*backtest
start: 2024-05-01 00:00:00
end: 2024-05-31 23:59:59
period: 1h
basePeriod: 15m
exchanges: [{"eid":"Futures_Binance","currency":"BTC_USDT"}]
*/

//@version=5
strategy("Simple RSI Strategy", overlay=true,  initial_capital=20, commission_value=0.1, commission_type=strategy.commission.percent)

// Define the hardcoded date (Year, Month, Day, Hour, Minute)- 1