Chiến lược giao dịch dừng lỗ và dừng lãi động EMA RSI MACD

1
Follow
1781
Followers
Tổng quan
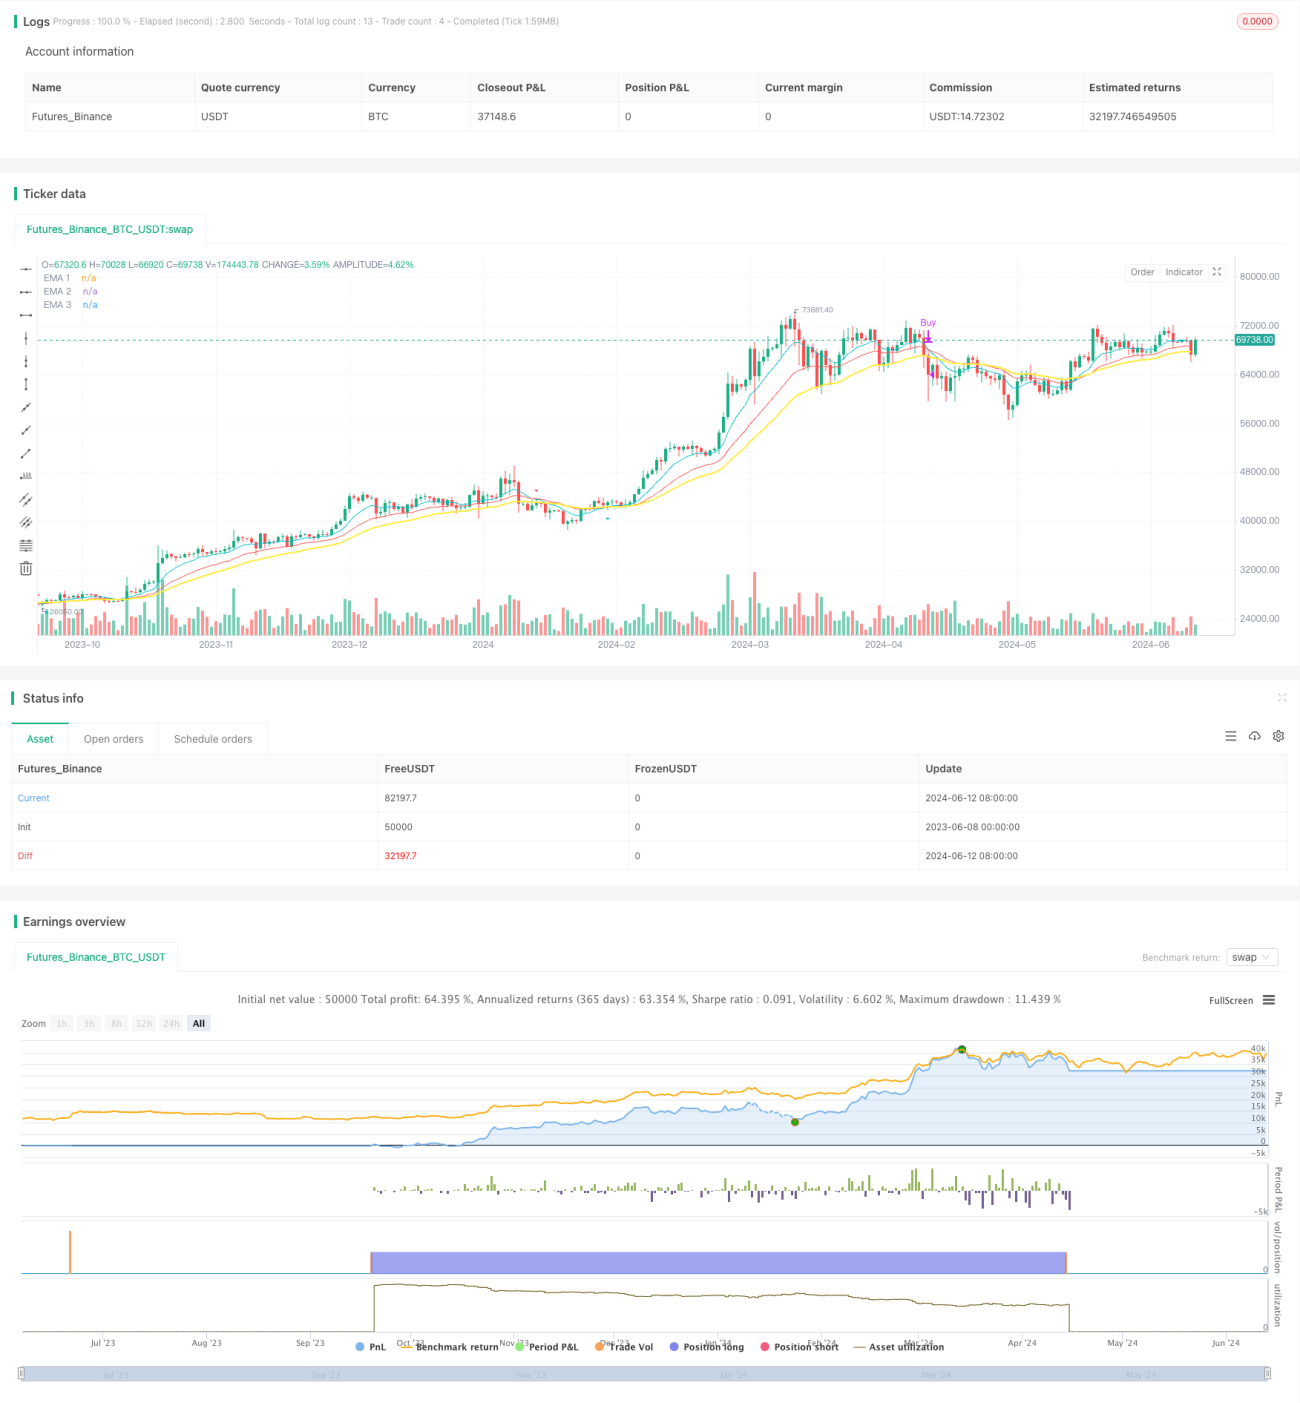
Chiến lược giao dịch này kết hợp ba chỉ số kỹ thuật: chỉ số di chuyển trung bình (EMA), chỉ số tương đối mạnh (RSI) và chỉ số di chuyển trung bình và phân tán (MACD) để tạo ra tín hiệu mua và bán khi giá đáp ứng một số điều kiện nhất định bằng cách phân tích mối quan hệ chéo và giá trị của chúng. Đồng thời, chiến lược này cũng đặt các điểm dừng động và dừng để quản lý rủi ro giao dịch.
Nguyên tắc chiến lược
- Tính trung bình giá đóng cửa cao thấp ((HLCC4) là dữ liệu cơ bản của chiến lược.
- Chỉ số EMA và RSI dựa trên HLCC4 được tính toán trong ba chu kỳ khác nhau.
- Tính giá trị của MACD columnar.
- Xác định sự giao thoa của EMA1 và EMA2:
- Khi EMA1 đeo EMA2, nó sẽ tạo ra tín hiệu báo hiệu.
- Khi EMA1 đi qua EMA2, nó tạo ra một tín hiệu giảm giá.
- Cân nhắc tổng hợp các chỉ số EMA, RSI và MACD để xác định xem điều kiện mua hoặc bán có được không:
- Điều kiện mua: EMA1 trên EMA2, HLCC4 cao hơn EMA3, RSI cao hơn giá trị giảm, giá đóng cửa cao hơn giá mở cửa, MACD hình trụ là dương.
- Điều kiện bán: EMA1 vượt qua EMA2, HLCC4 thấp hơn EMA3, RSI thấp hơn giá trị giảm, giá đóng cửa thấp hơn giá mở cửa, MACD âm.
- Nếu có tín hiệu ngược lại khi giữ vị trí, hãy xóa vị trí trước và mở một vị trí mới.
- Khi mua hoặc bán, hãy đặt giá dừng và giá dừng theo số điểm đã đặt.
Lợi thế chiến lược
- Kết hợp nhiều chỉ số kỹ thuật để đánh giá tổng hợp, tăng độ tin cậy của tín hiệu.
- Việc giới thiệu cơ chế dừng lỗ động có thể kiểm soát rủi ro hiệu quả.
- Khi có tín hiệu ngược lại, vị trí ban đầu sẽ bị xóa, tránh vấn đề giữ vị trí lặp lại.
- Các tham số có thể điều chỉnh, có khả năng thích ứng, có thể được tối ưu hóa theo các môi trường thị trường khác nhau.
Rủi ro chiến lược
- Trong các tình huống chấn động, sự giao thoa thường xuyên có thể dẫn đến quá nhiều giao dịch, làm tăng chi phí xử lý.
- Lệnh dừng dừng với số điểm cố định có thể không thích ứng với biến động của thị trường, dẫn đến việc dừng quá sớm hoặc dừng quá muộn.
- Chiến lược này phụ thuộc vào dữ liệu lịch sử và có thể không phản ứng kịp thời với các sự kiện bất ngờ hoặc hành vi bất thường.
Hướng tối ưu hóa chiến lược
- Có thể xem xét việc giới thiệu nhiều chỉ số kỹ thuật hoặc chỉ số cảm xúc thị trường, chẳng hạn như Brinband, ATR, v.v. để cải thiện độ chính xác của tín hiệu.
- Đối với dừng lỗ, có thể sử dụng các cách động hơn, chẳng hạn như theo dõi dừng hoặc điều chỉnh khoảng cách dừng lỗ theo tỷ lệ dao động.
- Có thể kết hợp với phân tích cơ bản, chẳng hạn như các sự kiện tin tức quan trọng, phát hành dữ liệu kinh tế, để lọc các tín hiệu giao dịch và tránh giao dịch trong thời gian đặc biệt.
- Đối với thiết lập các tham số, có thể sử dụng học máy hoặc thuật toán tối ưu hóa để tìm các tổ hợp tham số tối ưu.
Tóm tắt
Chiến lược này kết hợp nhiều chỉ số kỹ thuật như EMA, RSI và MACD để tạo thành một hệ thống giao dịch hoàn chỉnh. Trong các trường hợp có xu hướng, chiến lược có thể nắm bắt được xu hướng một cách hiệu quả và kiểm soát rủi ro bằng cách dừng lỗ động. Tuy nhiên, trong các trường hợp bất ổn, giao dịch thường xuyên có thể ảnh hưởng đến lợi nhuận.
Source
Pine
Strategy parameters
Related strategies
Comment
All comments (0)
No data
- 1