Chiến lược kết hợp đơn giản: Pivot Point Supertrend và Double Exponential Moving Average

Tổng quan
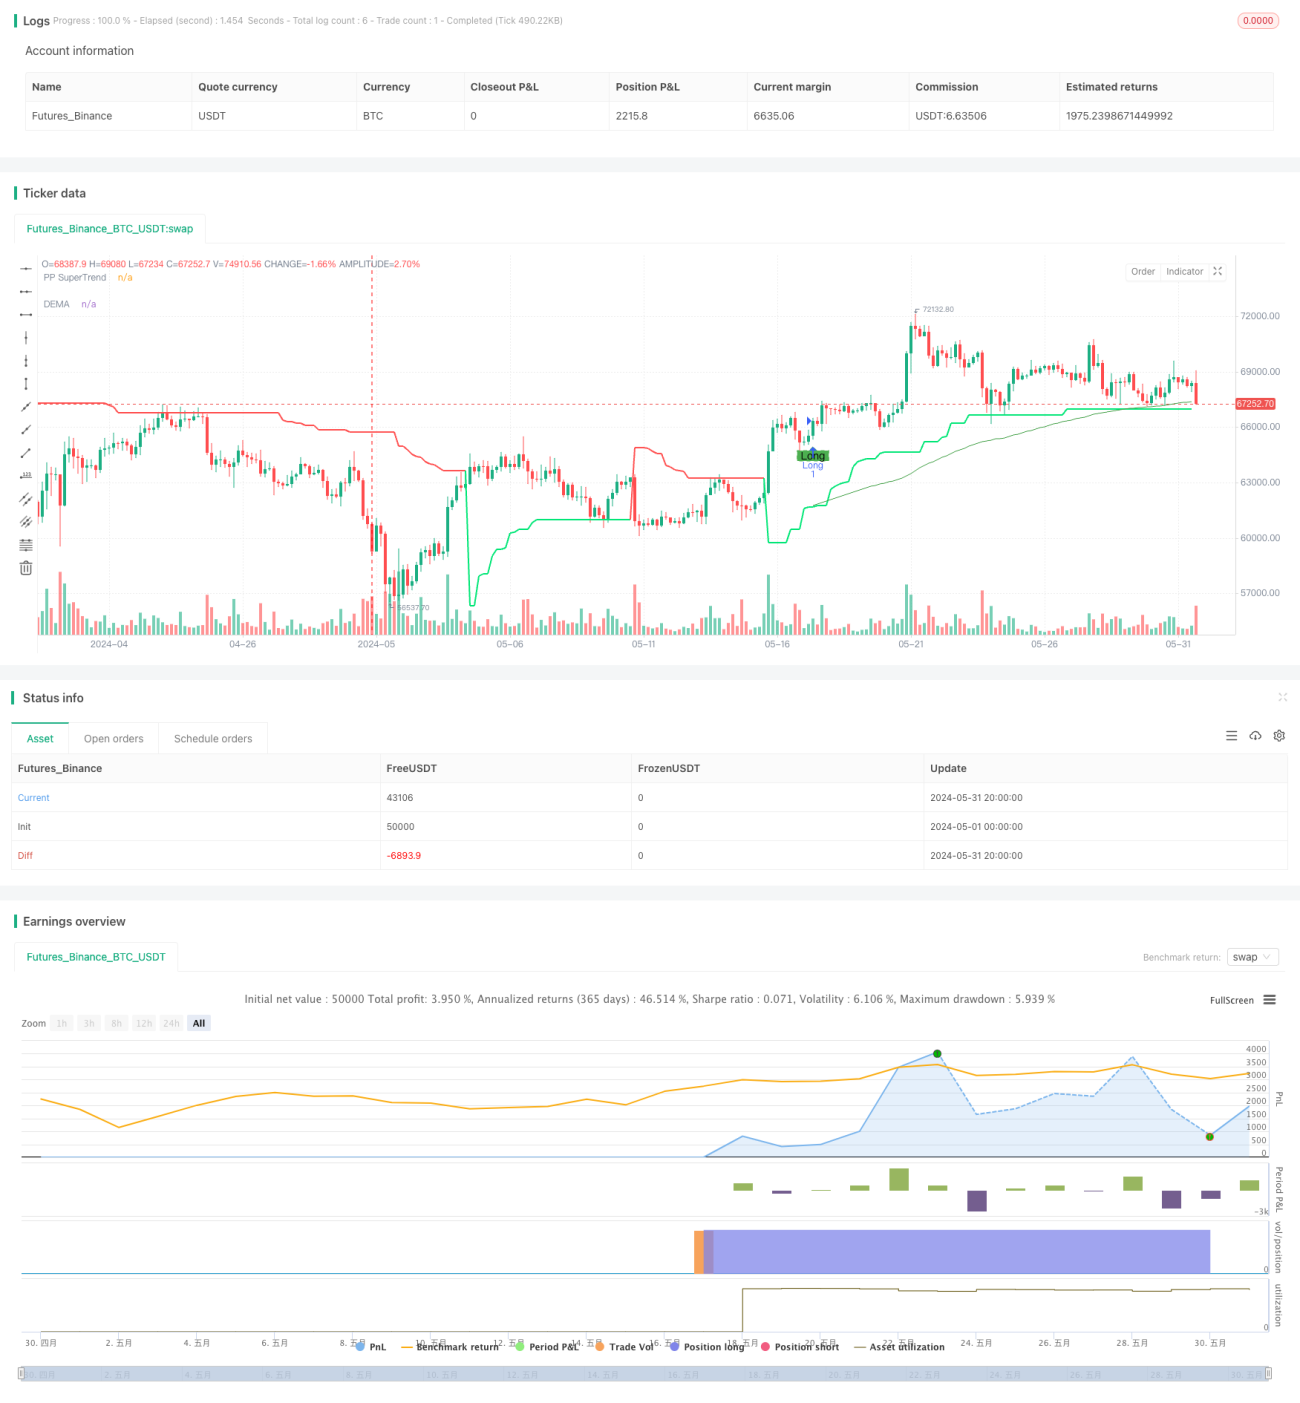
Chiến lược này kết hợp các chỉ số siêu xu hướng cốt lõi và các chỉ số di chuyển trung bình chỉ số kép ((DEMA) để phân tích mối quan hệ vị trí giữa giá cả trong hai chỉ số, để đánh giá tín hiệu giao dịch. Khi giá vượt qua chỉ số siêu xu hướng cốt lõi và cao hơn chỉ số DEMA, tạo ra nhiều tín hiệu; Khi giá giảm xuống chỉ số siêu xu hướng cốt lõi và thấp hơn chỉ số DEMA, tạo ra tín hiệu trống. Chiến lược này có thể nắm bắt xu hướng trung hạn của thị trường, đồng thời cũng có thể đối phó với biến động giá trong ngắn hạn.
Nguyên tắc chiến lược
- Tính toán chỉ số xu hướng siêu trọng tâm: Bằng cách tính trung bình giá cao nhất và giá thấp nhất trong một chu kỳ nhất định làm điểm trung tâm, sau đó tính theo chiều cao trung bình ((ATR) để hình thành hỗ trợ động và kháng cự.
- Tính toán chỉ số DEMA: Đầu tiên tính toán chỉ số di chuyển trung bình của giá đóng cửa ((EMA), sau đó thực hiện một lần di chuyển trung bình của chỉ số EMA, và cuối cùng bằng hai lần EMA trừ DEMA để có được chỉ số DEMA cuối cùng.
- Sản xuất tín hiệu giao dịch: Sản xuất tín hiệu nhiều khi giá đóng cửa phá vỡ xu hướng siêu xu hướng trung tâm và cao hơn chỉ số DEMA; Sản xuất tín hiệu tắt khi giá đóng cửa phá vỡ xu hướng siêu xu hướng trung tâm và thấp hơn chỉ số DEMA.
- Thiết lập dừng lỗ và chặn: tính toán giá dừng lỗ và chặn cụ thể dựa trên giá trị điểm (Pip Value) và số điểm dừng lỗ (Stop Loss Pips) và số điểm dừng lỗ (Take Profit Pips).
Lợi thế chiến lược
- Khả năng theo dõi xu hướng mạnh mẽ: Chỉ số xu hướng siêu điểm trung tâm có thể nắm bắt xu hướng thị trường một cách hiệu quả, trong khi chỉ số DEMA có thể loại bỏ tiếng ồn giá và cung cấp cơ sở phán đoán xu hướng mượt mà hơn, kết hợp với nhau có thể nắm bắt chính xác xu hướng chính của thị trường.
- Khả năng thích ứng: Bằng cách động điều chỉnh đường ray lên xuống của chỉ số xu hướng siêu điểm trung tâm, có thể thích ứng với các biến động thị trường khác nhau, tăng khả năng thích ứng của chiến lược.
- Khả năng kiểm soát rủi ro mạnh mẽ: thiết lập vị trí dừng lỗ và dừng dừng rõ ràng, có thể kiểm soát hiệu quả lỗ hổng rủi ro của một giao dịch, đồng thời có thể khóa lợi nhuận đã có kịp thời.
Rủi ro chiến lược
- Rủi ro thiết lập tham số: Hiệu suất của chiến lược phụ thuộc vào thiết lập nhiều tham số, chẳng hạn như chu kỳ điểm trung tâm, yếu tố ATR, độ dài DEMA, v.v. Sự kết hợp các tham số khác nhau có thể dẫn đến sự khác biệt lớn trong hiệu suất chiến lược, cần được lựa chọn và tối ưu hóa một cách cẩn thận.
- Rủi ro thị trường chấn động: Trong môi trường thị trường chấn động, tín hiệu giao dịch thường xuyên có thể dẫn đến giao dịch quá mức, làm tăng chi phí giao dịch và rủi ro trượt.
- Rủi ro thay đổi xu hướng: Khi xu hướng thị trường thay đổi, chiến lược có thể gặp phải tình huống thua lỗ liên tục, cần điều chỉnh chiến lược kịp thời kết hợp với các phương tiện phân tích khác.
Hướng tối ưu hóa chiến lược
- Tối ưu hóa tham số: Tìm ra sự kết hợp tham số tối ưu nhất, tăng sự ổn định và lợi nhuận của chiến lược bằng cách kiểm tra tối ưu hóa tham số cho các chu kỳ thời gian và các loại giao dịch khác nhau.
- Bộ lọc tín hiệu: Khi tín hiệu giao dịch được tạo ra, nó có thể được xác nhận lần thứ hai kết hợp với các chỉ số kỹ thuật khác hoặc đặc điểm hành vi giá, tăng độ tin cậy của tín hiệu và giảm thiệt hại do tín hiệu giả.
- Quản lý vị trí: Đổi đổi kích thước vị trí của mỗi giao dịch theo biến động của thị trường và khả năng chịu rủi ro của tài khoản, kiểm soát lỗ hổng rủi ro tổng thể.
- Tối ưu hóa danh mục: kết hợp chiến lược này với các chiến lược khác hoặc hệ thống giao dịch để cải thiện hiệu suất dài hạn của chiến lược bằng cách phân tán rủi ro và tăng cường ổn định.
Tóm tắt
Chiến lược này có lợi thế như khả năng theo dõi xu hướng mạnh mẽ, khả năng thích ứng mạnh mẽ, khả năng kiểm soát rủi ro mạnh mẽ, nhưng đồng thời cũng phải đối mặt với các rủi ro như thiết lập tham số, thị trường bất ổn và biến đổi xu hướng. Bằng các phương tiện như tối ưu hóa tham số, lọc tín hiệu, quản lý vị trí và tối ưu hóa danh mục, bạn có thể nâng cao hơn nữa sự ổn định và khả năng lợi nhuận của chiến lược và thích ứng tốt hơn với các môi trường thị trường khác nhau.
- 1