Chiến lược giao dịch định lượng lợi nhuận chưa thực hiện tương đối của EMA100 và NUPL

Tổng quan
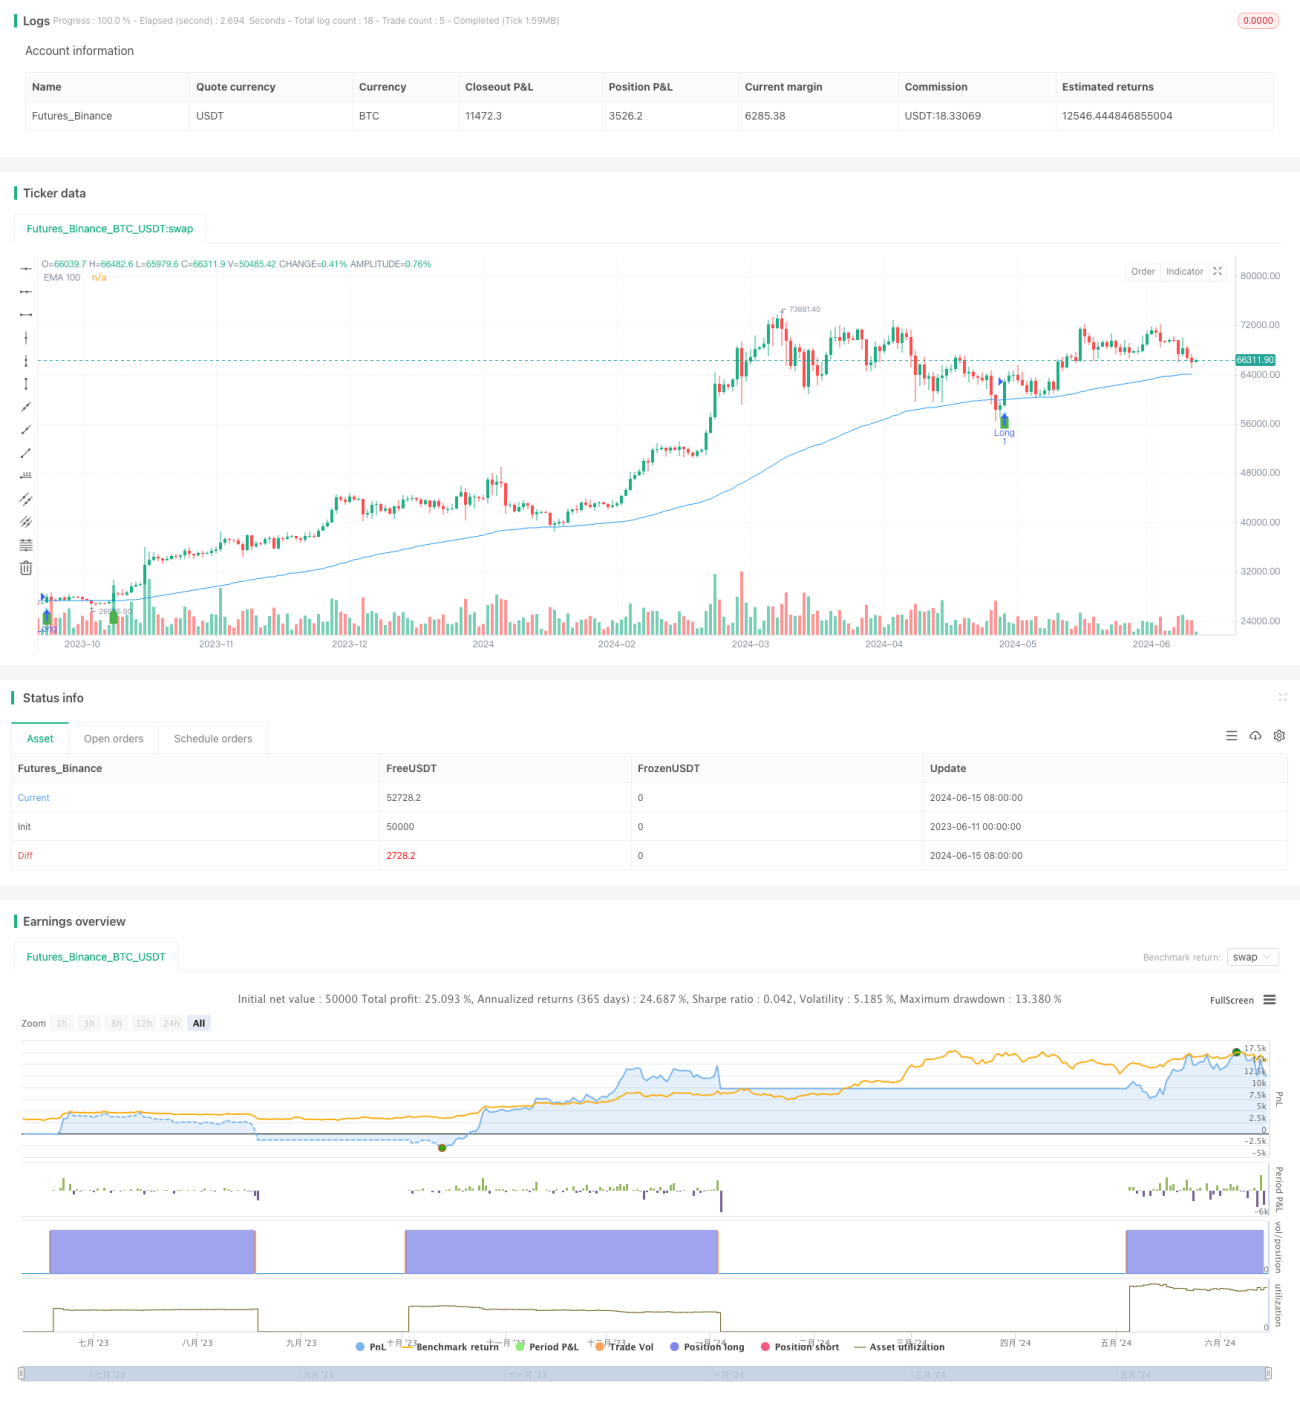
Chiến lược giao dịch này dựa trên trung bình di chuyển chỉ số 100 chu kỳ ((EMA100), lợi nhuận ròng chưa thực hiện ((NUPL) và ba chỉ số lợi nhuận tương đối chưa thực hiện để tạo ra tín hiệu giao dịch bằng cách phán đoán giá giao nhau với EMA100 và âm tính của NUPL và lợi nhuận tương đối chưa thực hiện. Gây nhiều tín hiệu khi giá vượt qua EMA100 và NUPL và lợi nhuận tương đối chưa thực hiện đều đúng; khi giá vượt qua EMA100 và NUPL và lợi nhuận tương đối chưa thực hiện đều âm tính.
Nguyên tắc chiến lược
- Tính toán 100 chu kỳ EMA như là một chỉ số định hướng chính
- Sử dụng NUPL và lợi nhuận chưa thực hiện tương đối như một chỉ số phụ để xác nhận cường độ và tính bền vững của xu hướng
- Trong khi giá vượt qua/giảm qua EMA100, NUPL và lợi nhuận tương đối chưa thực hiện đồng thời tạo ra tín hiệu làm nhiều/khác khi tích cực/thấp
- Sử dụng vị trí cố định 10% và đặt lệnh dừng 10% để kiểm soát rủi ro
- Khi giữ một vị trí đầu nhiều, nếu giá giảm xuống giá dừng lỗ, vị trí đầu nhiều sẽ bị xóa; khi giữ một vị trí đầu trống, nếu giá vượt qua giá dừng lỗ, vị trí đầu trống sẽ bị xóa
Phân tích lợi thế
- Đơn giản và dễ hiểu: Chiến lược có logic rõ ràng, sử dụng các chỉ số kỹ thuật phổ biến, dễ hiểu và thực hiện
- Theo dõi xu hướng: nắm bắt xu hướng chính thông qua EMA100, phù hợp để sử dụng trong thị trường xu hướng
- Kiểm soát rủi ro: thiết lập vị trí cố định và dừng lỗ, có thể kiểm soát rủi ro hiệu quả
- Khả năng thích ứng: Chiến lược này có thể áp dụng cho các thị trường và giao dịch khác nhau
Phân tích rủi ro
- Tín hiệu giả: Trong thị trường biến động, giá liên tục giao thoa với EMA100 có thể tạo ra nhiều tín hiệu giả, dẫn đến tổn thất
- Trở lại: EMA là một chỉ số trở lại, có thể phản ứng chậm khi xu hướng thay đổi, bỏ lỡ thời gian đầu vào tốt nhất
- Tối ưu hóa tham số: các tham số chiến lược (như chu kỳ EMA, kích thước vị trí, tỷ lệ dừng lỗ) cần được tối ưu hóa cho các thị trường khác nhau, các tham số không phù hợp có thể dẫn đến hiệu quả chiến lược kém
Hướng tối ưu hóa
- Tối ưu hóa tham số: Tối ưu hóa các tham số như chu kỳ EMA, kích thước vị trí, tỷ lệ dừng để cải thiện hiệu suất chiến lược
- Tín hiệu lọc: Thêm các chỉ số kỹ thuật khác hoặc chỉ số cảm xúc thị trường, lọc các tín hiệu giả
- Quản lý vị trí động: điều chỉnh vị trí động theo các yếu tố như biến động thị trường, lỗ hổng tài khoản, tăng lợi nhuận và kiểm soát rủi ro
- Danh mục đa vị trí: nắm giữ cả vị trí đa đầu và vị trí trống, bảo hiểm rủi ro thị trường, tăng sự ổn định chiến lược
Tóm tắt
Chiến lược giao dịch này tạo ra tín hiệu giao dịch thông qua EMA100, NUPL và ba chỉ số lợi nhuận tương đối chưa đạt được, có các ưu điểm như rõ ràng logic, khả năng kiểm soát rủi ro và khả năng thích ứng. Ngoài ra còn có các rủi ro như tín hiệu giả, chậm trễ và tối ưu hóa tham số. Trong tương lai, chiến lược có thể được tối ưu hóa và nâng cao bằng các phương thức tối ưu hóa tham số, lọc tín hiệu, quản lý vị trí động và kết hợp đa không gian.
- 1