Chiến lược giao dịch dừng lỗ động EMA

Tổng quan
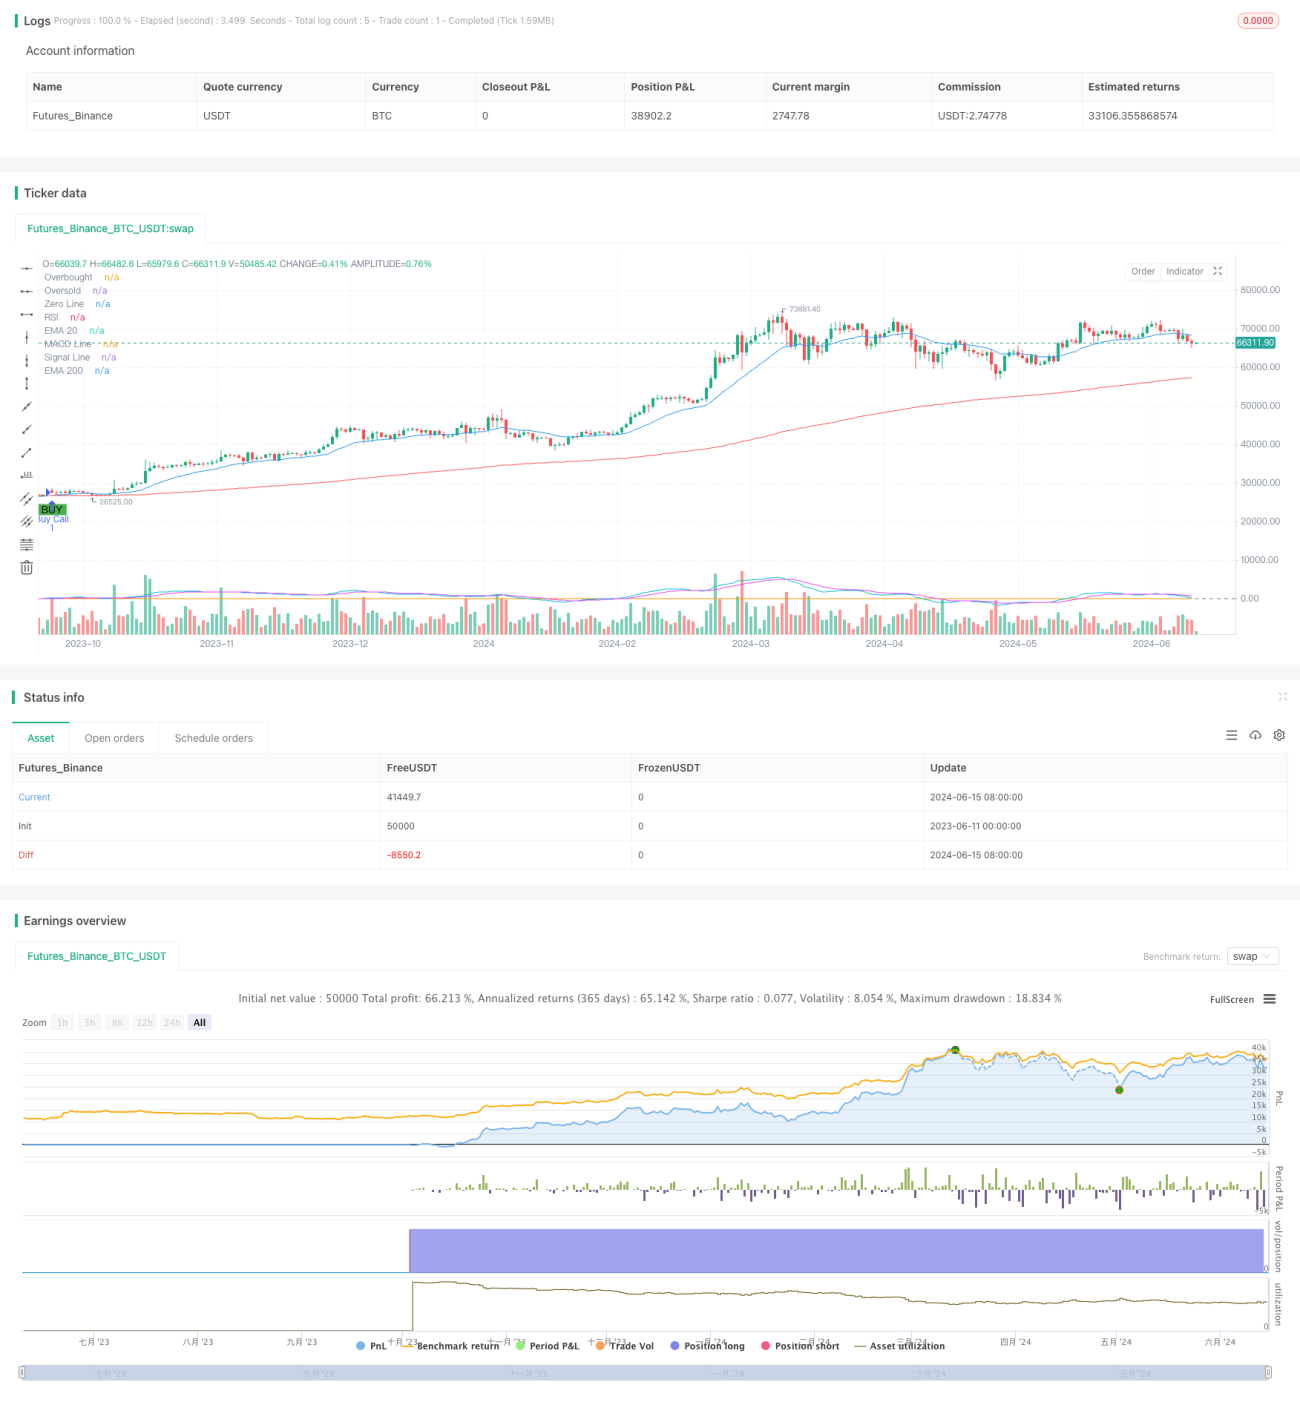
Chiến lược này dựa trên tín hiệu chéo của chỉ số di chuyển trung bình 20 ngày và 200 ngày (EMA) và kết hợp với chỉ số tương đối mạnh (RSI) và chỉ số phân tán kết hợp trung bình di chuyển (MACD) để xác nhận để tạo ra tín hiệu mua và bán. Đồng thời, chiến lược này sử dụng phương pháp dừng lỗ động và mục tiêu cố định để quản lý rủi ro giao dịch và khóa lợi nhuận.
Nguyên tắc chiến lược
- Tính EMA 20 ngày và 200 ngày, khi EMA 20 ngày vượt qua EMA 200 ngày, sẽ tạo ra tín hiệu mua; khi EMA 20 ngày vượt qua EMA 200 ngày, sẽ tạo ra tín hiệu bán.
- Sử dụng RSI và MACD để xác nhận tín hiệu chéo EMA, chỉ thực hiện mua khi RSI cao hơn 50 và đường MACD cao hơn đường tín hiệu; chỉ thực hiện bán khi RSI thấp hơn 50 và đường MACD thấp hơn đường tín hiệu.
- Thiết lập mục tiêu lợi nhuận cố định (ví dụ: 20%) và mức dừng lỗ ban đầu (ví dụ: 10%).
- Khi lợi nhuận giữ vị trí đạt được lợi nhuận mục tiêu, tăng giá dừng xuống dưới 10% giá hiện tại, để thực hiện dừng động.
- Khi giá chạm vào giá dừng động, vị trí yên là lợi nhuận.
Lợi thế chiến lược
- Kết hợp nhiều chỉ số kỹ thuật xác nhận tín hiệu giao dịch, tăng độ tin cậy của tín hiệu.
- Sử dụng phương pháp dừng lỗ động, trong khi khóa lợi nhuận, cho giá một số không gian rút lui, tránh tháo dỡ sớm.
- Đặt mục tiêu lợi nhuận cố định giúp kiểm soát rủi ro và đạt được lợi nhuận ổn định.
Rủi ro chiến lược
- Tín hiệu giao chéo EMA có thể xuất hiện thường xuyên trong các tín hiệu giả, dẫn đến tăng chi phí giao dịch.
- Trong một thị trường bất ổn, chiến lược này có thể dẫn đến tổn thất liên tục.
- Tỷ lệ thu nhập và lỗ hổng mục tiêu cố định có thể không phù hợp với các điều kiện thị trường khác nhau và cần được điều chỉnh theo biến động của thị trường.
Hướng tối ưu hóa chiến lược
- Thêm nhiều chỉ số kỹ thuật hoặc thị trường để tăng độ chính xác và độ tin cậy của tín hiệu.
- Sử dụng lãi suất mục tiêu thích ứng và lãi suất dừng, điều chỉnh động theo biến động của thị trường và đặc tính của tài sản.
- Kết hợp xu hướng thị trường và chu kỳ biến động, sử dụng các thiết lập tham số khác nhau trong các môi trường thị trường khác nhau.
Tóm tắt
Chiến lược này có khả năng tạo ra lợi nhuận ổn định trong thị trường đang đi theo xu hướng thông qua tín hiệu giao chéo EMA kết hợp với xác nhận RSI và MACD, và phương pháp quản lý rủi ro của dừng động và thu nhập mục tiêu cố định. Tuy nhiên, trong thị trường bất ổn, chiến lược này có thể gặp rủi ro giao dịch thường xuyên và thua lỗ liên tục. Do đó, cần được tối ưu hóa và cải tiến thêm để tăng khả năng thích ứng và sức mạnh của chiến lược.
- 1