Chiến lược giao dịch định lượng kết hợp EMA và siêu xu hướng

Tổng quan
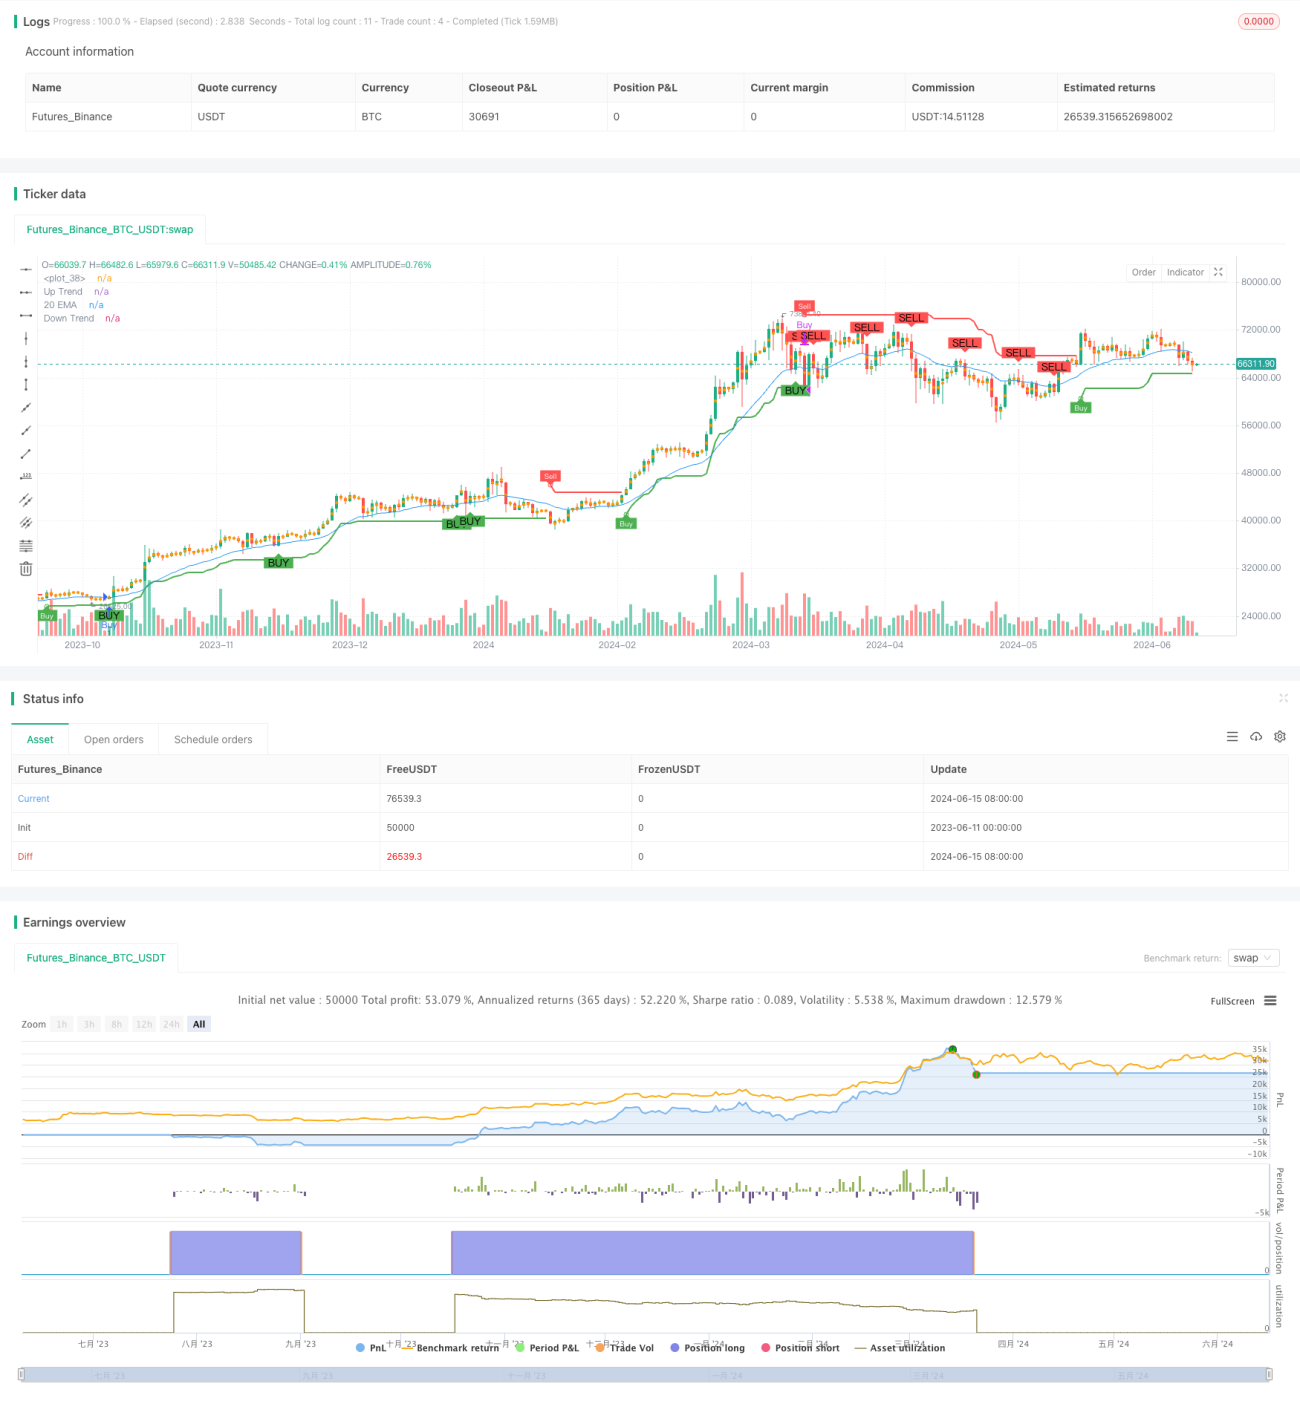
Chiến lược này kết hợp các chỉ số di chuyển trung bình (EMA) và các chỉ số xu hướng siêu (Supertrend) để tạo ra tín hiệu mua và bán. Một tín hiệu mua sẽ được tạo ra khi giá vượt qua 20 ngày EMA từ phía trên và chỉ số xu hướng siêu đang ở xu hướng giảm; Một tín hiệu bán sẽ được tạo ra khi giá giảm xuống 20 ngày EMA từ phía dưới và chỉ số xu hướng siêu đang ở xu hướng giảm. Chiến lược này được thiết kế để nắm bắt xu hướng, đồng thời sử dụng EMA làm điều kiện lọc để giảm tín hiệu giả.
Nguyên tắc chiến lược
- Tính toán 20 ngày EMA như là một điều kiện lọc để đánh giá xu hướng.
- Tính toán chỉ số siêu xu hướng, dựa trên phạm vi trung bình thực (ATR) và xu hướng đa không gian để vẽ lên và xuống đường ray.
- Các tín hiệu mua và bán được tạo ra dựa trên hướng xu hướng của chỉ số siêu xu hướng và vị trí của giá so với EMA ngày 20:
- Một tín hiệu mua được tạo ra khi giá vượt qua EMA 20 ngày từ trên và chỉ số siêu xu hướng đang ở xu hướng giảm giá.
- Một tín hiệu bán được tạo ra khi giá giảm xuống dưới EMA 20 ngày và chỉ số siêu xu hướng đang ở xu hướng giảm.
- Chiến lược: Bắt đầu giao dịch với tín hiệu mua và giảm bớt với tín hiệu bán.
Lợi thế chiến lược
- Kết hợp với EMA và chỉ số siêu xu hướng, có thể nắm bắt hiệu quả các hành vi xu hướng và giảm tín hiệu sai.
- Chỉ số siêu xu hướng dựa trên ATR, có khả năng điều chỉnh động khoảng cách lên xuống theo tỷ lệ biến động của thị trường khác nhau.
- EMA là một điều kiện lọc để đánh giá xu hướng, có thể đảm bảo mở vị trí theo hướng xu hướng và tăng tỷ lệ chiến lược.
- Lập luận của chiến lược rất đơn giản, dễ hiểu và dễ thực hiện.
Rủi ro chiến lược
- Trong thị trường bất ổn, chiến lược này có thể tạo ra các tín hiệu mua và bán thường xuyên, dẫn đến quá nhiều giao dịch và phí tổn.
- Chiến lược phụ thuộc vào các chỉ số EMA và siêu xu hướng, trong một số điều kiện thị trường, các chỉ số này có thể bị mất hiệu lực hoặc bị chậm trễ.
- Chiến lược này không tính đến quản lý rủi ro, chẳng hạn như dừng lỗ và quản lý vị trí, điều này có thể dẫn đến sự rút lui lớn hơn khi thị trường biến động mạnh.
Hướng tối ưu hóa chiến lược
- Tham gia các cơ chế dừng lỗ, chẳng hạn như dừng động theo ATR để kiểm soát tổn thất tối đa cho một giao dịch.
- Tối ưu hóa các tham số của chỉ số EMA và siêu xu hướng, chẳng hạn như sử dụng phương pháp tối ưu hóa tham số để tìm ra sự kết hợp tham số tốt nhất, nâng cao khả năng thích ứng và ổn định của chiến lược.
- Tiếp tục quản lý vị trí, thay đổi kích thước vị trí theo biến động của thị trường hoặc thu nhập của tài khoản để kiểm soát rủi ro tổng thể.
- Xem xét thêm các điều kiện lọc khác như khối lượng giao dịch, tỷ lệ biến động, v.v. để giảm thêm tín hiệu giả.
Tóm tắt
Chiến lược này tạo ra tín hiệu mua và bán bằng cách kết hợp các chỉ số EMA 20 ngày và siêu xu hướng để nắm bắt hành vi theo xu hướng. Ưu điểm của chiến lược là logic đơn giản, kết hợp các chỉ số EMA và siêu xu hướng có thể làm giảm hiệu quả các tín hiệu giả. Tuy nhiên, trong thị trường biến động, chiến lược có thể giao dịch thường xuyên và thiếu các biện pháp quản lý rủi ro.
- 1