Chiến lược giao cắt EMA nâng cao: Hệ thống giao dịch thích ứng dựa trên mục tiêu dừng lỗ và lợi nhuận động

Tổng quan
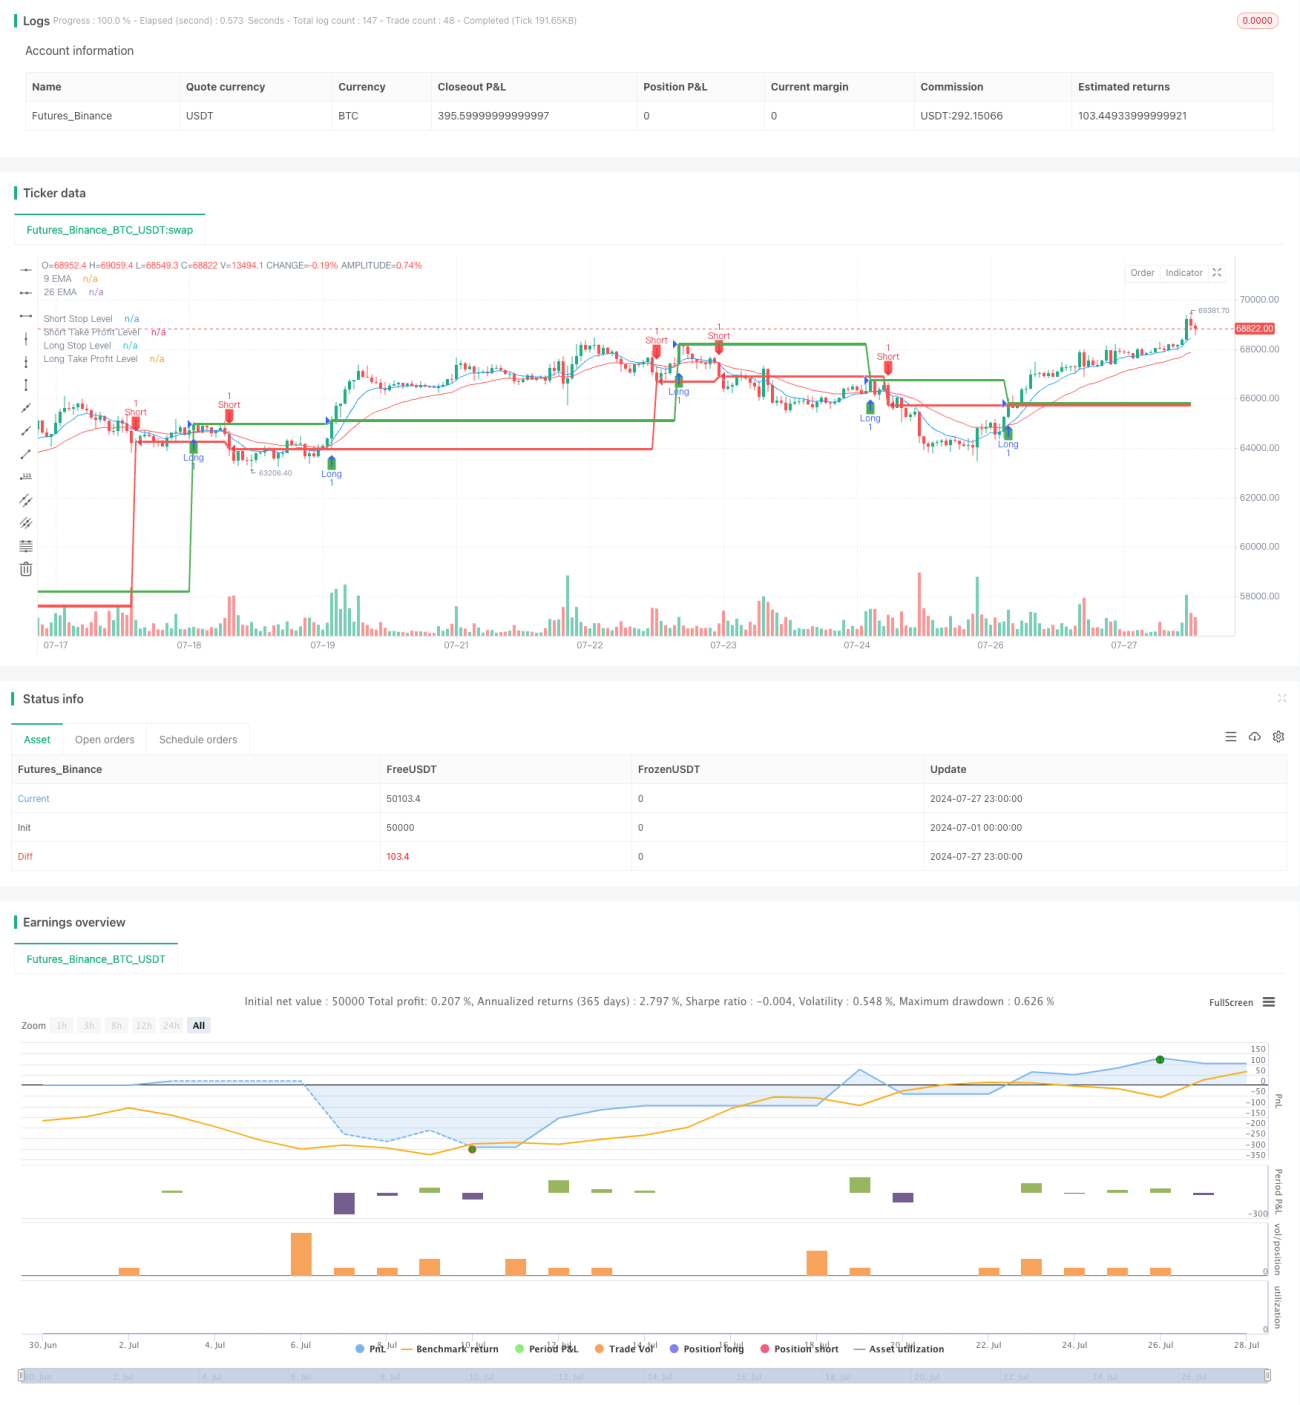
Chiến lược giao dịch EMA cao cấp này là một hệ thống giao dịch tự điều chỉnh, sử dụng giao dịch của chỉ số moving average (EMA) để tạo ra tín hiệu giao dịch. Chiến lược này kết hợp EMA 9 chu kỳ và 26 chu kỳ, kích hoạt tín hiệu mua và bán khi chúng giao dịch.
Nguyên tắc chiến lược
Cốt lõi của chiến lược này là sử dụng sự giao thoa của hai EMA để đánh giá xu hướng thị trường.
- Sử dụng EMA 9 chu kỳ và 26 chu kỳ làm chỉ số chính.
- Khi 9EMA đi qua 26EMA từ bên dưới, kích hoạt tín hiệu mua.
- Khi 9EMA đi qua 26EMA từ trên, kích hoạt một tín hiệu bán.
- Mỗi giao dịch được thiết lập mục tiêu dừng lỗ và lợi nhuận cố định, tính bằng tick.
- Mua giao dịch với mục tiêu dừng lỗ 90 tick dưới giá nhập, mục tiêu lợi nhuận 270 tick trên giá nhập.
- Bán giao dịch với mục tiêu dừng lỗ 90 tick trên giá thầu, mục tiêu lợi nhuận 270 tick dưới giá thầu.
- Mô tả đường EMA, tín hiệu giao dịch, mức dừng và lợi nhuận trên biểu đồ để phân tích trực quan.
- Thiết lập chức năng cảnh báo để thông báo cho các nhà giao dịch khi xảy ra giao dịch EMA.
Lợi thế chiến lược
- Theo dõi xu hướng: Sử dụng EMA để nắm bắt xu hướng thị trường, giúp bạn giao dịch theo xu hướng.
- Quản lý rủi ro: Mục tiêu dừng lỗ và lợi nhuận cố định giúp kiểm soát rủi ro và lợi nhuận tiềm năng của mỗi giao dịch.
- Hình ảnh: Hiển thị rõ ràng các tín hiệu và mức giá quan trọng trên biểu đồ, giúp phân tích và ra quyết định.
- Tự động hóa: Chiến lược có thể tự động thực hiện giao dịch, giảm sự can thiệp của con người và ảnh hưởng của cảm xúc.
- Tính linh hoạt: có thể điều chỉnh các tham số EMA và thiết lập dừng / lợi nhuận theo các thị trường và khung thời gian khác nhau.
- Cảnh báo thời gian thực: Giúp các nhà giao dịch nắm bắt cơ hội thị trường kịp thời, tăng tốc độ phản ứng.
Rủi ro chiến lược
- Quá giao dịch: Trong một thị trường bất ổn, các EMA có thể giao nhau thường xuyên, dẫn đến quá nhiều tín hiệu sai.
- Sự chậm trễ: EMA là một chỉ số chậm trễ, có thể phản ứng chậm hơn khi xu hướng đảo ngược.
- Đặt dừng lỗ / lợi nhuận: Trong thị trường có nhiều biến động, dừng lỗ cố định có thể quá nhỏ và mục tiêu lợi nhuận có thể quá lớn.
- Thiếu nhận diện môi trường thị trường: Chiến lược không tính đến môi trường thị trường tổng thể, có thể giao dịch trong điều kiện thị trường không phù hợp.
- Sự phụ thuộc vào chỉ số duy nhất: chỉ dựa vào EMA Cross có thể bỏ qua các thông tin thị trường quan trọng khác.
Hướng tối ưu hóa chiến lược
- Mục tiêu dừng lỗ và lợi nhuận động: Hãy xem xét sử dụng ATR để động điều chỉnh mức dừng lỗ và lợi nhuận để phù hợp với biến động của thị trường.
- Thêm điều kiện lọc: giới thiệu các chỉ số kỹ thuật khác (như RSI hoặc MACD) như tín hiệu xác nhận, giảm đột phá giả.
- Nhận biết môi trường thị trường: Thêm chỉ số cường độ xu hướng ((như ADX), chỉ thực hiện giao dịch trong thị trường xu hướng mạnh.
- Phân tích nhiều khung thời gian: kết hợp với các khung thời gian dài hơn để xác nhận xu hướng tổng thể.
- Quản lý vị trí: thực hiện các chức năng tạm dừng và gia tăng phần để tối ưu hóa quản lý vốn.
- Phản hồi và tối ưu hóa: Phản hồi toàn diện cho các tổ hợp tham số khác nhau để tìm ra thiết lập tối ưu nhất.
- Tăng bộ lọc khối lượng giao dịch: tránh giao dịch trong thời gian khối lượng giao dịch thấp, giảm nguy cơ trượt điểm và phá vỡ giả.
Tóm tắt
Chiến lược giao dịch EMA cao cấp này cung cấp một khuôn khổ đơn giản và hiệu quả để nắm bắt xu hướng thị trường và quản lý rủi ro. Bằng cách kết hợp các tín hiệu giao dịch EMA, các tham số quản lý rủi ro cố định và cảnh báo thời gian thực, chiến lược này cung cấp cho các nhà giao dịch một hệ thống giao dịch toàn diện. Tuy nhiên, để có hiệu quả tốt hơn trong giao dịch thực tế, nên tối ưu hóa và thử nghiệm thêm.
- 1