1
tập trung vào
1750
Người theo dõi
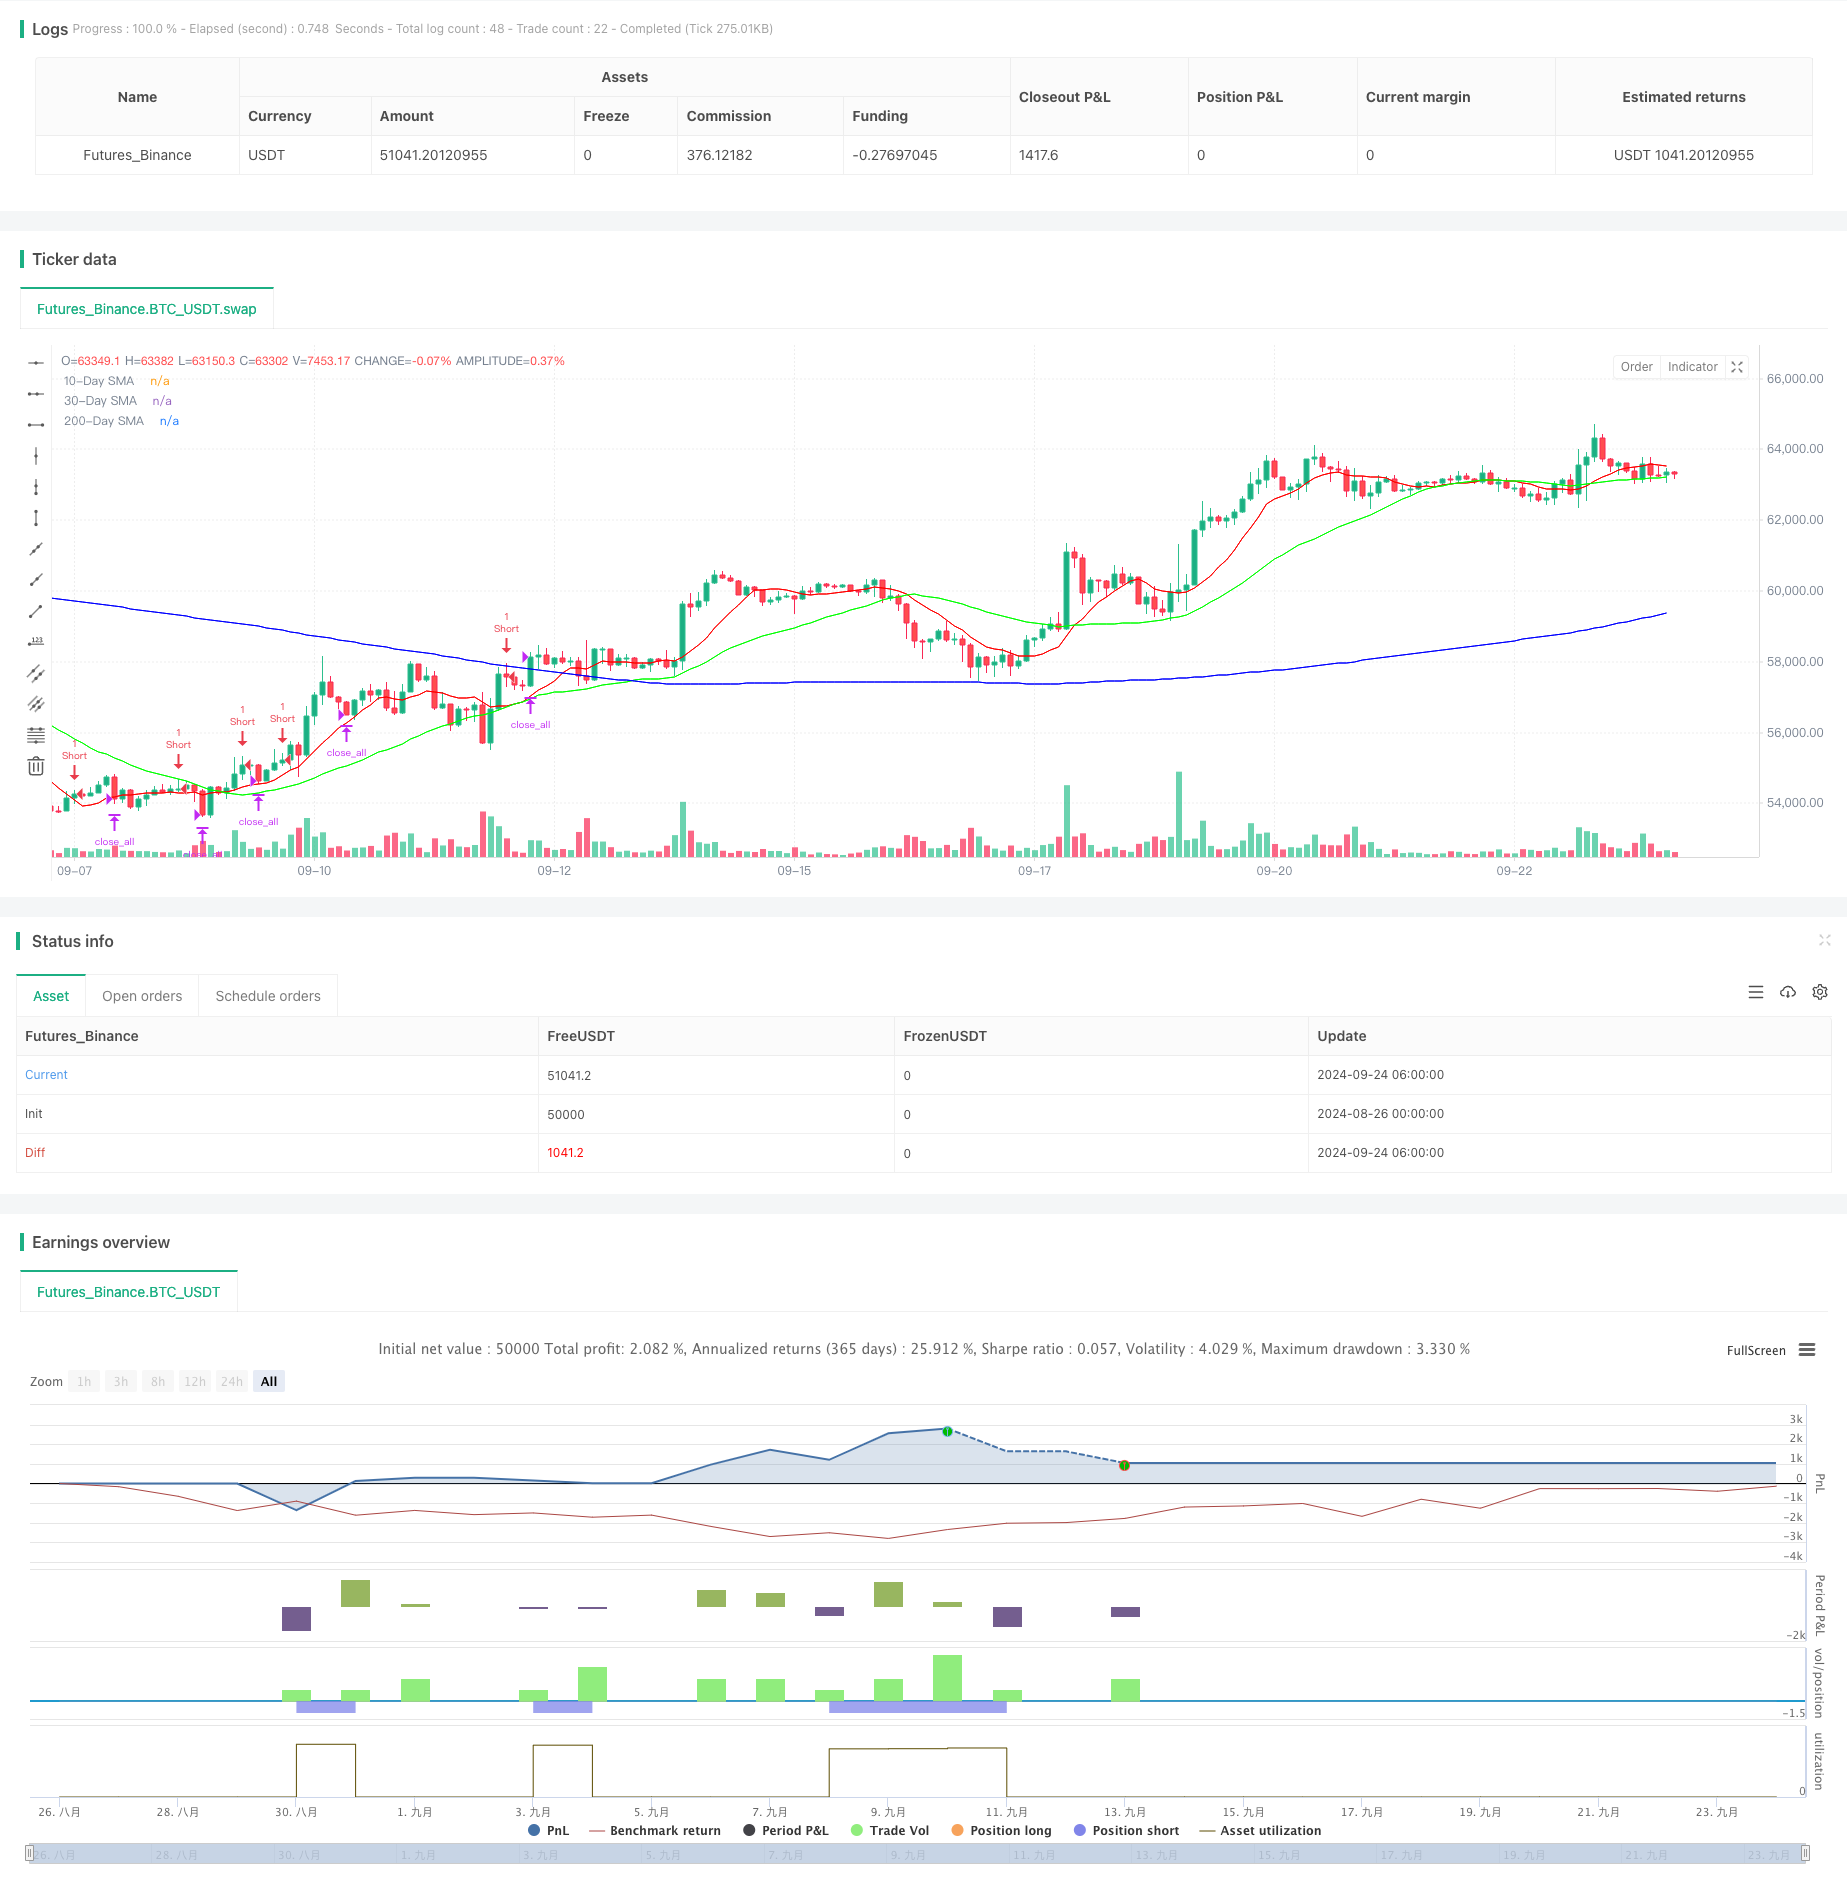
Tổng quan
Chiến lược này chủ yếu sử dụng chỉ số tương đối mạnh (RSI) và đường trung bình di chuyển đơn giản (SMA) để xác định tình trạng mua quá mức tiềm năng và cơ hội đảo ngược, và tối ưu hóa tỷ lệ lợi nhuận rủi ro bằng cách xây dựng các vị trí theo đợt. Ý tưởng cốt lõi của chiến lược là giá tài sản trong xu hướng giảm dài hạn và khi có quá mức mua trong thời gian ngắn, và khi thị trường có quá mức bán hoặc tín hiệu chuyển hướng.
Nguyên tắc chiến lược
Chiến lược này bao gồm một số bước quan trọng:
- Xác định xu hướng dài hạn: Sử dụng đường trung bình di chuyển đơn giản 200 ngày ((SMA) làm bộ lọc xu hướng dài hạn. Chiến lược sẽ chỉ xem xét cơ hội giảm giá khi giá thấp hơn đường SMA 200 ngày.
- Xác định tình trạng quá mua: Sử dụng chỉ số RSI hai chu kỳ cao hơn 75 trong hai ngày liên tiếp để đánh giá tình trạng quá mua ngắn hạn.
- Xây dựng lô hàng: Xây dựng lô hàng ban đầu với 10% vị trí, sau đó tăng dần theo xu hướng giá. Khi giá cao hơn giá xây dựng lô hàng trước đó, lần lượt tăng 20% , 30% và 40% vị trí.
- Điều kiện thoát: Khi RSI 2 chu kỳ thấp hơn 30 (có nghĩa là có thể đi vào trạng thái bán tháo) hoặc vượt qua 30 ngày SMA trên SMA ngày 10 (có nghĩa là có thể có xu hướng đảo ngược), xóa tất cả các vị trí.
Lợi thế chiến lược
- Kiểm soát rủi ro: Kiểm soát hiệu quả các lỗ hổng rủi ro của giao dịch đơn lẻ bằng cách xây dựng và quản lý các vị trí động.
- Theo dõi xu hướng: Sử dụng các kết hợp trung bình di chuyển ngắn hạn dài hạn để nắm bắt xu hướng dài hạn và xác định cơ hội đảo ngược ngắn hạn.
- Tính linh hoạt: Các tham số chiến lược có thể được điều chỉnh theo các môi trường thị trường khác nhau và các loại giao dịch, có khả năng thích ứng.
- Tự động hóa thực hiện: Chiến lược logic rõ ràng, dễ lập trình để thực hiện giao dịch tự động.
Rủi ro chiến lược
- Rủi ro thị trường: Trong một thị trường tăng mạnh, có thể có nguy cơ mất mát liên tục.
- Rủi ro đặt hàng quá mức: Cơ chế đặt hàng theo lô có thể dẫn đến tiếp xúc quá mức với thị trường dưới tín hiệu sai.
- Rủi ro về tính thanh khoản: Trong một thị trường ít thanh khoản, giao dịch lớn có thể làm tăng điểm trượt.
- Hạn chế về chỉ số kỹ thuật: Các chỉ số kỹ thuật như RSI và SMA có thể tạo ra tín hiệu sai, dẫn đến quyết định giao dịch sai.
Hướng tối ưu hóa chiến lược
- Tiếp theo, các chỉ số biến động được đưa vào: kết hợp với các chỉ số biến động như ATR (trung lượng sóng thực trung bình) và các chỉ số biến động khác để điều chỉnh động để xây dựng và giảm giá.
- Tối ưu hóa logic đặt cược: Bạn có thể cân nhắc việc điều chỉnh tỷ lệ đặt cược theo mức độ biến động của thị trường để tránh đặt cược quá mức trong thời gian biến động cao.
- Tăng bộ lọc cơ bản: kết hợp các yếu tố cơ bản như chỉ số cảm xúc thị trường hoặc dữ liệu kinh tế vĩ mô để tăng độ tin cậy của tín hiệu nhập cảnh.
- Tối ưu hóa phản hồi: Tối ưu hóa các thiết lập tham số thông qua việc phản hồi dữ liệu lịch sử lớn, nâng cao tính ổn định và lợi nhuận của chiến lược.
Tóm tắt
Chiến lược đảo ngược mua quá mức RSI là một chiến lược giao dịch đường ngắn kết hợp phân tích kỹ thuật và quản lý rủi ro. Chiến lược này nhằm mục đích nắm bắt các cơ hội đảo ngược tiềm năng của thị trường bằng cách sử dụng tín hiệu mua quá mức RSI và phán đoán xu hướng SMA.
Mã nguồn chiến lược
/*backtest
start: 2024-08-26 00:00:00
end: 2024-09-24 08:00:00
period: 2h
basePeriod: 2h
exchanges: [{"eid":"Futures_Binance","currency":"BTC_USDT"}]
*/

//@version=5
strategy("TPS Short Strategy by Larry Conners", overlay=true)

// Define parameters as inputs
sma_length_200 = input.int(200, title="200-Day SMA Length")
rsi_length_2 = input.int(2, title="2-Period RSI Length")
sma_length_10 = input.int(10, title="10-Day SMA Length")
sma_length_30 = input.int(30, title="30-Day SMA Length")

// Define colors as RGB values
color_sma_200 = input.color(color.rgb(0, 0, 255), title="200-Day SMA Color") // Blue
color_sma_10 = input.color(color.rgb(255, 0, 0), title="10-Day SMA Color") // Red
color_sma_30 = input.color(color.rgb(0, 255, 0), title="30-Day SMA Color") // Green

// Calculate indicators
sma_200 = ta.sma(close, sma_length_200)
rsi_2 = ta.rsi(close, rsi_length_2)
sma_10 = ta.sma(close, sma_length_10)
sma_30 = ta.sma(close, sma_length_30)

// Define conditions
below_sma_200 = close < sma_200
rsi_2_above_75_two_days = rsi_2[1] > 75 and rsi_2 > 75
price_higher_than_entry = na(strategy.opentrades.entry_price(0)) ? false : close > strategy.opentrades.entry_price(0)

// Entry conditions
if (below_sma_200 and rsi_2_above_75_two_days and na(strategy.opentrades.entry_price(0)))
    strategy.entry("Short", strategy.short, qty=1) // Short 10% of the position

// Scaling in conditions
if (price_higher_than_entry)
    strategy.entry("Short2", strategy.short, qty=2) // Short 20% more of the position

if (price_higher_than_entry)
    strategy.entry("Short3", strategy.short, qty=3) // Short 30% more of the position

if (price_higher_than_entry)
    strategy.entry("Short4", strategy.short, qty=4) // Short 40% more of the position

// Exit conditions
exit_condition_rsi_below_30 = rsi_2 < 30
exit_condition_sma_cross = ta.crossover(sma_10, sma_30)

if (exit_condition_rsi_below_30 or exit_condition_sma_cross)
    strategy.close_all() // Close all positions

// Plot indicators
plot(sma_200, color=color_sma_200, title="200-Day SMA")
plot(sma_10, color=color_sma_10, title="10-Day SMA")
plot(sma_30, color=color_sma_30, title="30-Day SMA")