
Tổng quan
Chiến lược này là một hệ thống giao dịch động lực kết hợp nhiều chỉ số kỹ thuật, đồng thời tích hợp cơ chế dừng lỗ linh hoạt. Chiến lược này chủ yếu sử dụng tín hiệu chéo của ba chỉ số kỹ thuật phổ biến là RSI, EMA và MACD để đánh giá xu hướng và động lực của thị trường và đưa ra quyết định giao dịch dựa trên đó.
Nguyên tắc chiến lược
Nguyên tắc cốt lõi của chiến lược này là xác định các cơ hội giao dịch tiềm năng thông qua sự phối hợp của nhiều chỉ số:
- Sử dụng RSI (chỉ số tương đối mạnh) để đánh giá thị trường đang quá mua hoặc quá bán.
- Sử dụng chéo ngắn hạn và dài hạn của EMA để xác nhận sự thay đổi trong xu hướng.
- Các mối quan hệ giữa các đường tín hiệu và các đường cột của MACD (Moving Average Convergence Divergence) để xác minh thêm động lượng.
Chiến lược sẽ kích hoạt tín hiệu giao dịch khi các chỉ số này đáp ứng cùng một điều kiện cụ thể. Ví dụ: khi EMA ngắn hạn vượt qua EMA dài hạn, RSI dưới mức mua quá mức và MACD cao hơn đường tín hiệu, sẽ tạo ra tín hiệu đa. Các điều kiện ngược lại sẽ kích hoạt tín hiệu tháo lỗ.
Ngoài ra, chiến lược này còn kết hợp các cơ chế dừng lỗ, cho phép các nhà giao dịch đặt mức dừng và dừng lỗ phù hợp theo sở thích rủi ro của họ. Việc giới thiệu tỷ lệ lợi nhuận rủi ro đã tối ưu hóa hơn nữa chiến lược quản lý tiền.
Lợi thế chiến lược
- Tương tác đa chỉ số: Bằng cách kết hợp RSI, EMA và MACD, chiến lược có thể phân tích thị trường từ nhiều góc độ, nâng cao độ tin cậy của tín hiệu.
- Quản lý vốn linh hoạt: Cài đặt tỷ lệ phần trăm dừng lỗ và tỷ lệ lợi nhuận cho phép chiến lược được điều chỉnh cho phù hợp với các môi trường thị trường khác nhau và sở thích rủi ro cá nhân.
- Theo dõi xu hướng kết hợp với động lực: EMA giao nhau cung cấp tín hiệu xu hướng, trong khi RSI và MACD bổ sung yếu tố động lực, giúp nắm bắt xu hướng thị trường mạnh mẽ.
- Hình ảnh hỗ trợ: Chiến lược vẽ các chỉ số quan trọng trên biểu đồ, giúp thương nhân hiểu trực quan tình trạng thị trường và logic chiến lược.
- Các tham số có thể điều chỉnh: chu kỳ và ngưỡng của chỉ số chính có thể được điều chỉnh thông qua các tham số đầu vào, tăng khả năng thích ứng của chiến lược.
Rủi ro chiến lược
- Quá giao dịch: Trong thị trường bất ổn, nhiều chỉ số có thể thường xuyên phát ra các tín hiệu mâu thuẫn, dẫn đến quá giao dịch.
- Sự chậm trễ: Tất cả các chỉ số được sử dụng là các chỉ số chậm trễ, có thể không phản ứng kịp thời trong thị trường thay đổi nhanh chóng.
- Rủi ro phá vỡ giả: Chiến lược giao chéo EMA dễ bị ảnh hưởng bởi tiếng ồn thị trường, có thể tạo ra tín hiệu phá vỡ giả.
- Nhận thức tham số: Hiệu suất của chiến lược phụ thuộc rất nhiều vào tham số được chọn, các môi trường thị trường khác nhau có thể yêu cầu cài đặt tham số khác nhau.
- Thiếu tính đến cảm xúc thị trường: Chiến lược này dựa trên các chỉ số kỹ thuật, không tính đến các yếu tố cơ bản và cảm xúc thị trường, có thể không hoạt động tốt khi xảy ra các sự kiện tin tức quan trọng.
Hướng tối ưu hóa chiến lược
- Tiếp tục áp dụng bộ lọc biến động: Bạn có thể xem xét thêm các chỉ số ATR (trung lượng sóng thực) để giảm tần số giao dịch trong môi trường biến động thấp và cải thiện chất lượng tín hiệu.
- Thêm bộ lọc cường độ xu hướng: Ví dụ, sử dụng ADX để đảm bảo chỉ giao dịch trong xu hướng mạnh và tránh giao dịch thường xuyên trong thị trường biến động.
- Động thái dừng lỗ: có thể điều chỉnh mức dừng lỗ theo động thái biến động của thị trường, ví dụ như sử dụng số nhân của ATR để đặt.
- Bộ lọc thời gian: Tăng giới hạn cửa sổ thời gian giao dịch, tránh các thời điểm mở và đóng có biến động lớn.
- Thêm phân tích khối lượng giao dịch: Bằng cách kết hợp các chỉ số khối lượng giao dịch, chẳng hạn như OBV ((tiếng sóng năng lượng) hoặc CMF ((chỉ số dòng tiền), để xác minh tính hiệu quả của xu hướng giá.
- Tối ưu hóa học máy: Sử dụng thuật toán học máy để thay đổi động và tối ưu hóa các tham số chiến lược để thích ứng với môi trường thị trường thay đổi.
Tóm tắt
Chiến lược giao dịch động lực chéo đa chỉ số này cung cấp cho các nhà giao dịch một hệ thống giao dịch toàn diện bằng cách sử dụng các chỉ số kỹ thuật như RSI, EMA và MACD, kết hợp với cơ chế dừng lỗ linh hoạt. Ưu điểm của chiến lược là khả năng phân tích thị trường từ nhiều góc độ và phương pháp quản lý rủi ro linh hoạt. Tuy nhiên, giống như tất cả các chiến lược giao dịch, nó cũng phải đối mặt với các rủi ro như giao dịch quá mức và nhạy cảm với các tham số.
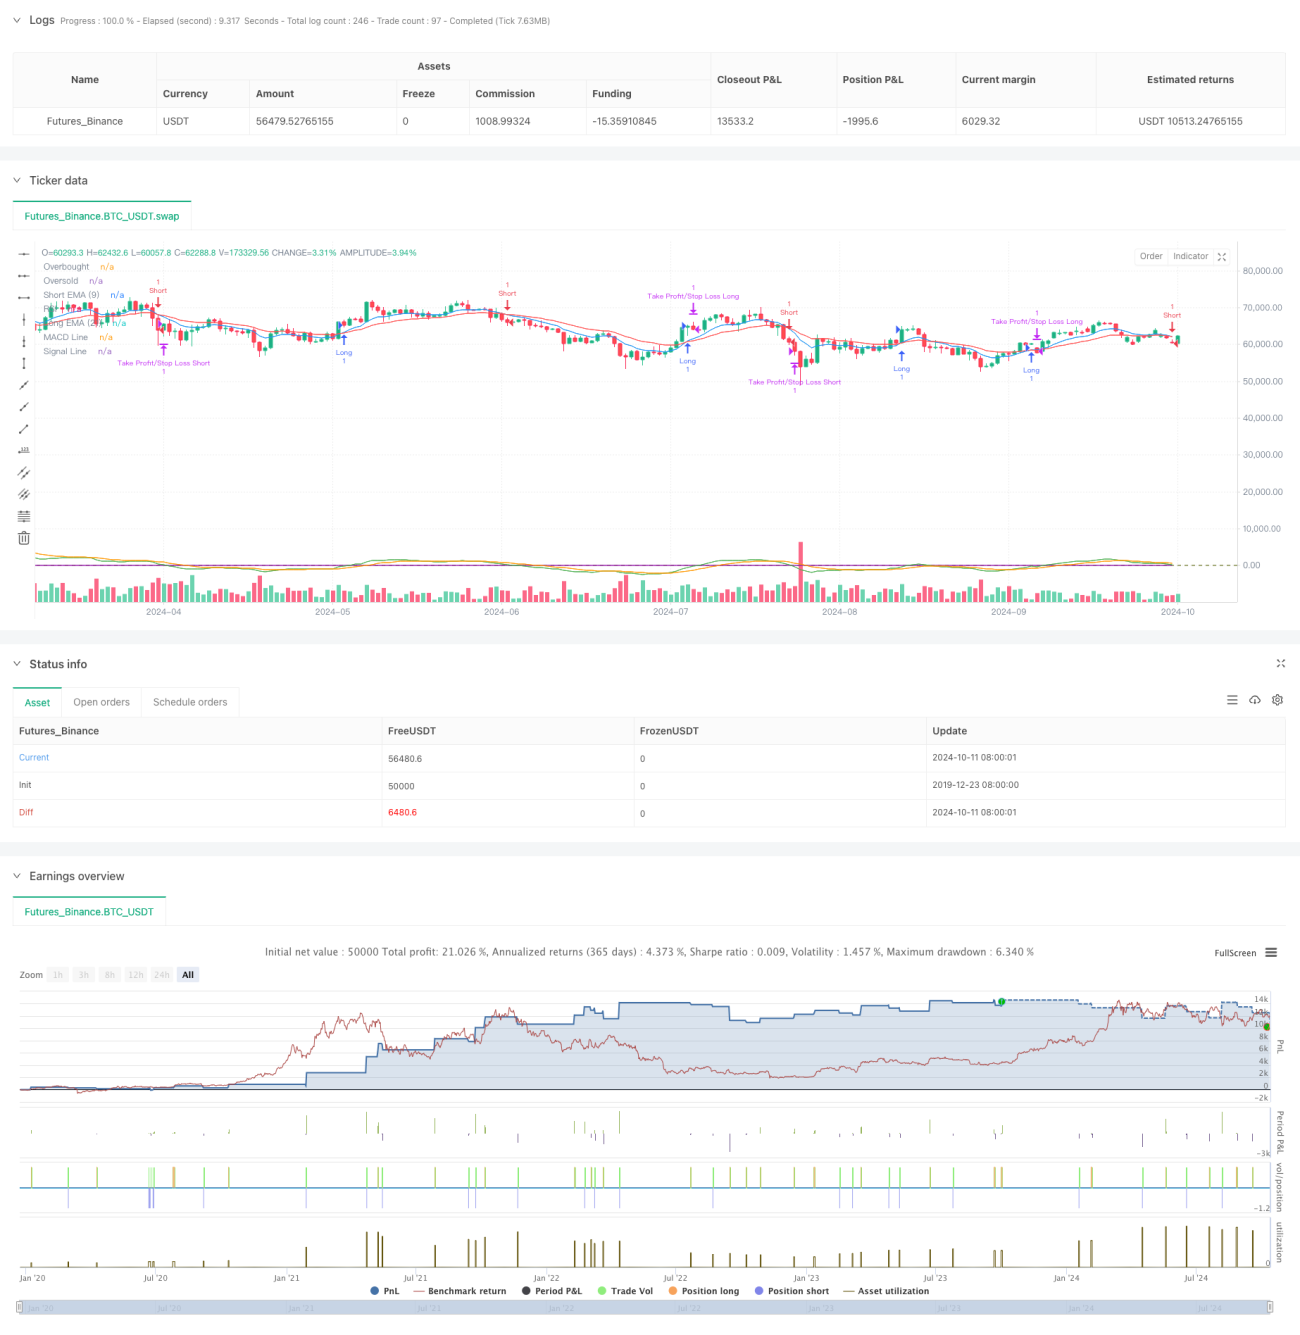
/*backtest
start: 2019-12-23 08:00:00
end: 2024-10-12 08:00:00
period: 1d
basePeriod: 1d
exchanges: [{"eid":"Futures_Binance","currency":"BTC_USDT"}]
*/

//@version=5
strategy("Crypto Futures Day Trading with Profit/Limit/Loss", overlay=true, margin_long=100, margin_short=100)

// Parameters for the strategy- 1