Chiến lược giao dịch theo xu hướng thích ứng kết hợp Bollinger Bands và RSI

Tổng quan
Chiến lược này là một hệ thống theo dõi xu hướng kết hợp với nhiều chỉ số kỹ thuật, kết hợp với ba chỉ số cổ điển thông qua Brin, RSI và MACD để nắm bắt cơ hội giao dịch trong giai đoạn biến động thị trường và chuyển đổi xu hướng. Chiến lược này sử dụng phương pháp gia tăng quyền hạn theo kiểu kim tự tháp để quản lý rủi ro thông qua kiểm soát khoảng cách giao dịch nghiêm ngặt.
Nguyên tắc chiến lược
Chiến lược này được xây dựng dựa trên 3 tín hiệu xác nhận:
- Sử dụng chỉ số RSI để xác định vùng quá mua quá bán, RSI <45 được coi là quá bán, RSI >55 được coi là quá mua
- Xác định vị trí giá thông qua đường băng Brin, tạo tín hiệu khi giá gần hoặc vượt qua đường băng Brin
- Sử dụng MACD Gold Fork Dead Fork để xác nhận xu hướng và mở lệnh sau khi cộng hưởng với tín hiệu RSI và Blink
Chiến lược cũng đặt khoảng cách giao dịch tối thiểu (15 chu kỳ), tránh giao dịch quá mức và quản lý kho theo kiểu kim tự tháp.
Lợi thế chiến lược
- Xác thực chéo nhiều chỉ số kỹ thuật, giảm đáng kể tín hiệu giả
- Cơ chế tăng cường kim tự tháp giúp sử dụng tài chính hiệu quả hơn
- Thiết lập khoảng thời gian giao dịch tối thiểu, kiểm soát tần suất giao dịch hiệu quả
- Các tham số chỉ số có thể điều chỉnh, có khả năng thích ứng mạnh mẽ
- Có cơ chế thanh toán tự động, kiểm soát lỗ hổng rủi ro
Rủi ro chiến lược
- Nhiều chỉ báo có thể gây ra độ trễ tín hiệu
- Có thể xảy ra giao dịch thường xuyên trong thị trường bất ổn
- Lưu trữ kim tự tháp có thể gây thiệt hại lớn hơn nếu xu hướng đảo ngược
- RSI cố định có thể không phù hợp với tất cả các tình huống thị trường
Hướng tối ưu hóa chiến lược
- Tiếp theo, chúng ta sẽ đưa ra các mức RSI tự điều chỉnh theo biến động của thị trường.
- Thêm chỉ báo âm lượng làm xác nhận phụ trợ
- Thuật toán quản lý vị trí tối ưu hóa kim tự tháp
- Tham gia vào các cơ chế giảm tổn thất linh hoạt hơn
- Xem xét các đặc điểm chu kỳ của thị trường, động thái điều chỉnh khoảng giao dịch
Tóm tắt
Chiến lược này tìm kiếm lợi nhuận ổn định bằng cách phối hợp hợp tác động của nhiều chỉ số kỹ thuật, đồng thời kiểm soát rủi ro. Mặc dù có một số sự chậm trễ, chiến lược đã thể hiện khả năng thích ứng và ổn định tốt hơn thông qua các cơ chế quản lý rủi ro và tối ưu hóa tham số hợp lý. Trong tương lai, có thể nâng cao hơn nữa hiệu suất chiến lược bằng cách giới thiệu cơ chế tự thích ứng và quản lý vị thế tốt hơn.
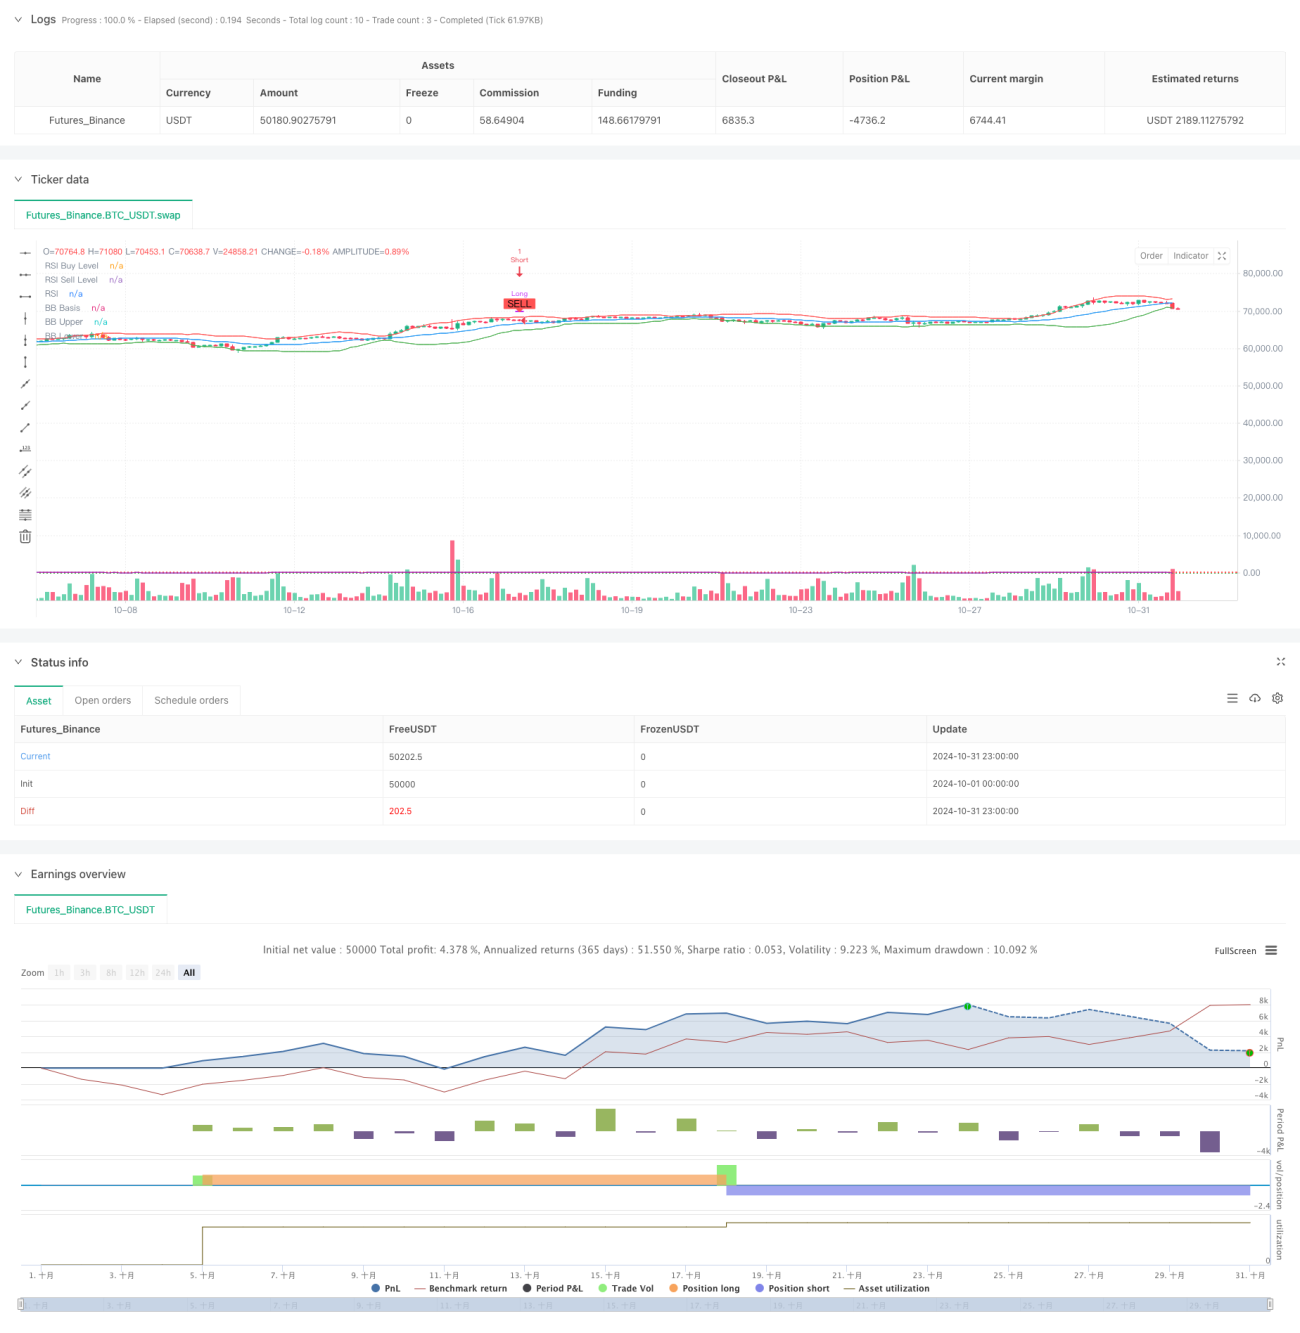
/*backtest
start: 2024-10-01 00:00:00
end: 2024-10-31 23:59:59
period: 3h
basePeriod: 3h
exchanges: [{"eid":"Futures_Binance","currency":"BTC_USDT"}]
*/

//@version=5
strategy("[ETH] Optimized Trend Strategy", shorttitle="Lorenzo-SuperScalping", overlay=true, pyramiding=3, initial_capital=100000, currency=currency.USD)

// === Input Parameters === //- 1