Chiến lược tổng hợp theo xu hướng RSI Momentum đa kỳ và Triple EMA

Tổng quan
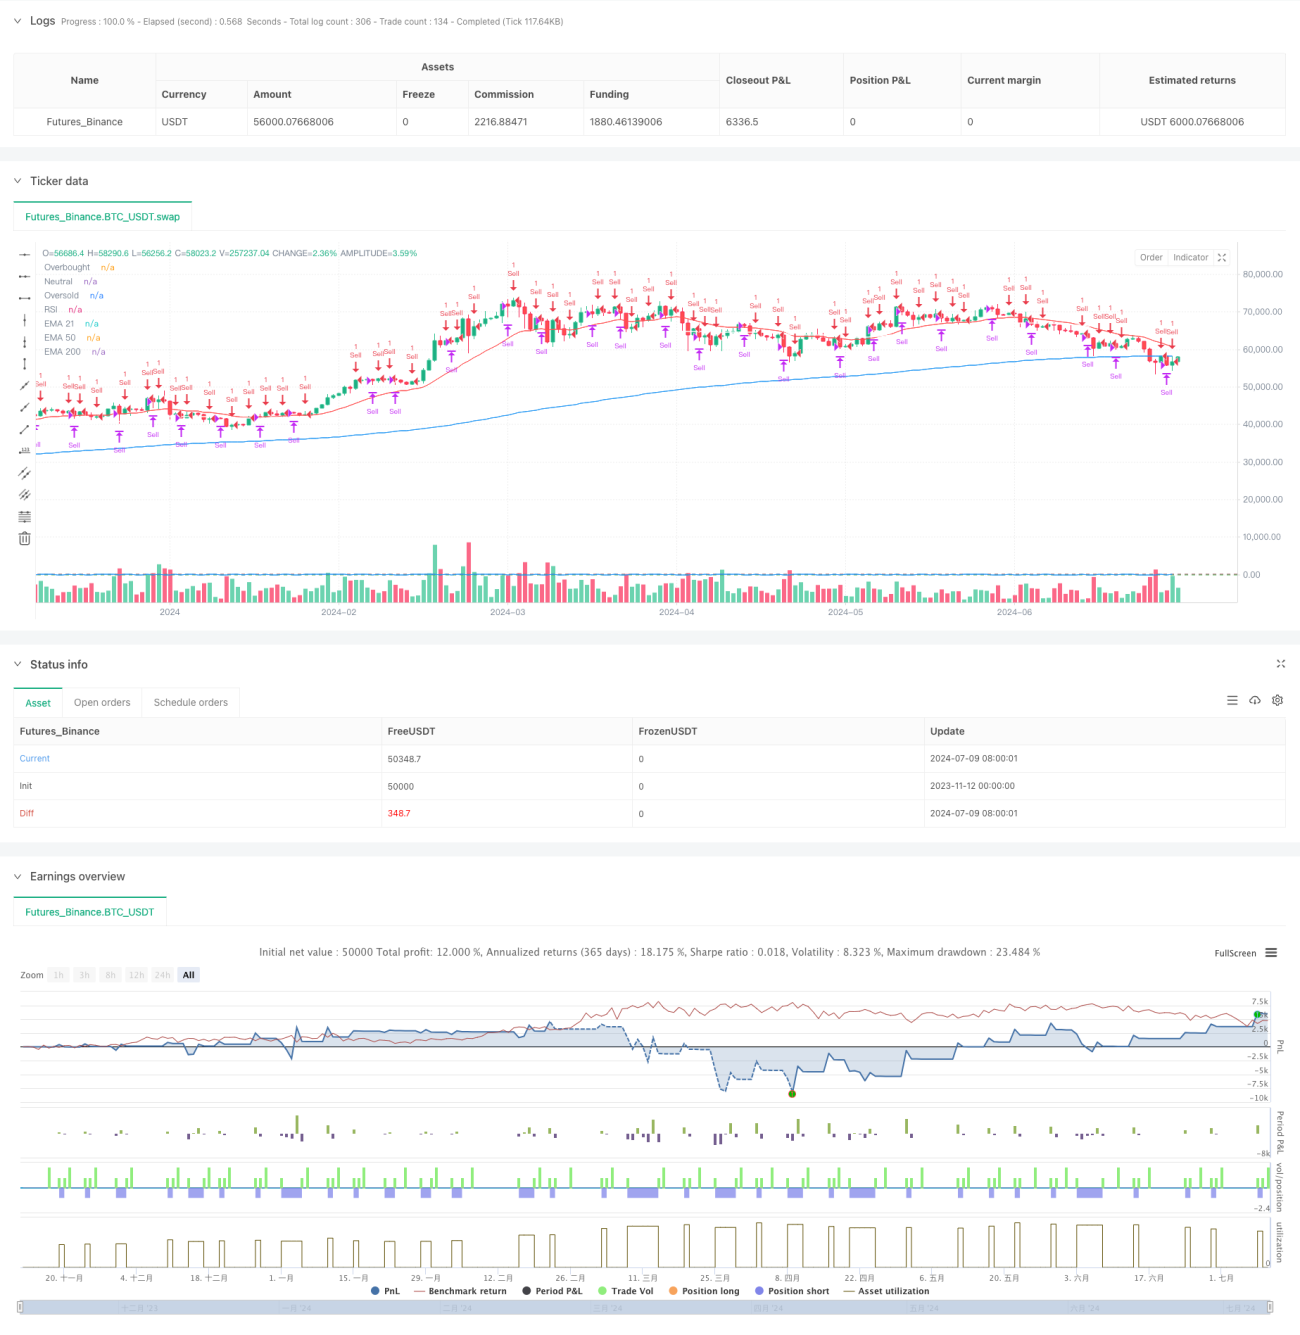
Chiến lược này là một hệ thống giao dịch phức hợp kết hợp các chỉ số động lực RSI và chỉ số xu hướng EMA. Nó hoạt động trong hai chu kỳ thời gian 1 phút và 5 phút, và các quyết định giao dịch được đưa ra thông qua tín hiệu mua bán quá mức của RSI và phán đoán xu hướng của EMA ba. Chiến lược bao gồm cả theo dõi xu hướng và bao gồm các tính năng quay trở lại bình quân, có thể nắm bắt cơ hội giao dịch trong các môi trường thị trường khác nhau.
Nguyên tắc chiến lược
Chiến lược sử dụng EMA ba ngày 21/50/200 làm chuẩn định hướng, kết hợp với chỉ số RSI được cải tiến (được tính toán theo phương pháp Chebyshev) để xác định tình trạng quá mua quá bán của thị trường. Trong chu kỳ 1 phút, khi RSI phá vỡ 94, mở lệnh giảm giá, giảm giá bằng 4 giờ và thiết lập lệnh dừng bảo đảm khi RSI quay trở lại 50. Trong chu kỳ 5 phút, khi giá phá vỡ EMA 200 ngày và mở lỗ, giảm giá khi RSI vượt quá hoặc giảm giá.
Lợi thế chiến lược
- Phân tích nhiều chu kỳ thời gian nâng cao độ tin cậy tín hiệu
- Kết hợp các chỉ số xu hướng và động lực
- Có hệ thống bảo hiểm, kiểm soát rủi ro
- Sử dụng phương pháp tính toán RSI cải tiến, tín hiệu chính xác hơn
- Tránh lặp lại giao dịch thông qua quản lý vị trí
- Khả năng thích ứng với môi trường thị trường khác nhau
Rủi ro chiến lược
- Giao dịch thường xuyên có thể dẫn đến phí cao hơn
- Có thể thường xuyên kích hoạt dừng lỗ trong thị trường biến động mạnh
- Chỉ số RSI có thể tạo ra tín hiệu giả trong một số điều kiện thị trường
- Chiến lược đa chu kỳ có thể bị trì hoãn trong việc xác nhận tín hiệu
- Tín hiệu giao chéo của EMA có thể gây hiểu nhầm trong thị trường biến động
Hướng tối ưu hóa chiến lược
- Giới thiệu bộ lọc tỷ lệ dao động, điều chỉnh tham số trong thời gian dao động cao
- Tăng cơ chế xác nhận khối lượng giao dịch
- Tối ưu hóa RSI, xem xét điều chỉnh động lực
- Thêm nhiều chỉ số kỹ thuật để kiểm tra chéo
- Giới thiệu cơ chế tham số thích ứng
- Phát triển các cơ chế ngăn chặn lỗ hổng tinh vi hơn
Tóm tắt
Chiến lược này cải thiện sự ổn định và độ tin cậy của giao dịch bằng cách kết hợp nhiều chỉ số kỹ thuật và phân tích nhiều chu kỳ thời gian. Mặc dù có một số rủi ro, nhưng có thể kiểm soát rủi ro hiệu quả thông qua quản lý vị trí hợp lý và cơ chế dừng lỗ.
- 1