
Tổng quan
Đây là một chiến lược theo dõi xu hướng dựa trên phân tích hình dạng Bollinger Bands và Bollinger Graphs. Chiến lược này chủ yếu dựa trên việc quan sát các đặc điểm hình dạng Bollinger Graphs khi giá chạm vào Bollinger Bands, kết hợp với mối quan hệ tỷ lệ của đường dẫn lên xuống với thực thể để đánh giá điểm đảo ngược có thể xảy ra trên thị trường.
Nguyên tắc chiến lược
Lập luận cốt lõi của chiến lược dựa trên một số yếu tố quan trọng sau: đầu tiên, xác định phạm vi biến động giá bằng cách tính toán Bollinger 20 chu kỳ; thứ hai, phân tích tỷ lệ của đường dẫn lên xuống của biểu đồ khi giá chạm vào vùng Bollinger, được coi là tín hiệu đảo ngược tiềm năng khi tỷ lệ vượt quá ngưỡng thiết lập; thứ ba, thiết lập điểm dừng lỗ bằng cách tính toán các ngưỡng hỗ trợ quan trọng và ngưỡng kháng cự; và cuối cùng, tính toán số lượng nắm giữ mỗi giao dịch dựa trên tỷ lệ cố định của tổng tài khoản (<1%) để quản lý rủi ro.
Lợi thế chiến lược
- Kiểm soát rủi ro chính xác: Sử dụng mô hình quản lý rủi ro tỷ lệ cố định để đảm bảo các lỗ hổng rủi ro cho mỗi giao dịch nằm trong phạm vi có thể kiểm soát được
- Tính linh hoạt điểm vào: cung cấp nhiều lựa chọn giá vào để thích nghi với phong cách giao dịch khác nhau
- Kết hợp các chỉ số kỹ thuật: kết hợp các dải Bollinger Bands với phân tích hình dạng photon để cải thiện độ tin cậy của tín hiệu
- Cài đặt dừng lỗ hợp lý: Cài đặt dừng lỗ theo quy luật hoạt động của thị trường thông qua các điểm kháng cự hỗ trợ quan trọng
- Quản lý giao dịch hoàn hảo: bao gồm cơ chế hết hạn lệnh, tránh các hoạt động sai lầm do tín hiệu hết hạn
Rủi ro chiến lược
- Rủi ro biến động thị trường nhanh chóng: tỷ lệ dẫn có thể tạo ra tín hiệu sai trong thị trường biến động mạnh
- Rủi ro quản lý vốn: Mô hình rủi ro tỷ lệ cố định có thể dẫn đến vị trí quá nhỏ trong trường hợp thua lỗ liên tục
- Rủi ro thiết lập dừng lỗ: Tính toán mức kháng cự hỗ trợ có thể không chính xác trong một số điều kiện thị trường
- Tùy thuộc vào chu kỳ thời gian: chiến lược chủ yếu dựa trên cấp độ mặt trời, có thể bỏ lỡ cơ hội trong khung thời gian nhỏ hơn
Hướng tối ưu hóa chiến lược
- Tiến hành số lượng giao dịch: có thể tăng độ tin cậy của tín hiệu bằng cách tăng phân tích số lượng giao dịch khi xác nhận tín hiệu
- Tối ưu hóa cơ chế dừng lỗ: xem xét việc giới thiệu dừng động, tự động điều chỉnh khoảng cách dừng lỗ theo biến động của thị trường
- Thêm bộ lọc môi trường thị trường: thêm các chỉ số cường độ xu hướng, điều chỉnh các tham số chiến lược trong các môi trường thị trường khác nhau
- Cải thiện quản lý vị trí: xem xét việc giới thiệu cơ chế quản lý vị trí động, điều chỉnh lỗ hổng rủi ro theo biến động của thị trường
- Thêm bộ lọc thời gian: có thể thêm bộ lọc thời gian để tránh giao dịch trong thời gian thị trường biến động lớn
Tóm tắt
Chiến lược này đã xây dựng một hệ thống giao dịch tương đối hoàn hảo bằng cách kết hợp các công cụ phân tích kỹ thuật cổ điển với các phương pháp quản lý rủi ro hiện đại. Điểm mạnh cốt lõi của chiến lược là kiểm soát rủi ro nghiêm ngặt và cơ chế nhập cảnh linh hoạt, nhưng đồng thời cũng cần chú ý đến sự thay đổi của môi trường thị trường và xác minh độ tin cậy của tín hiệu trong ứng dụng thực tế.
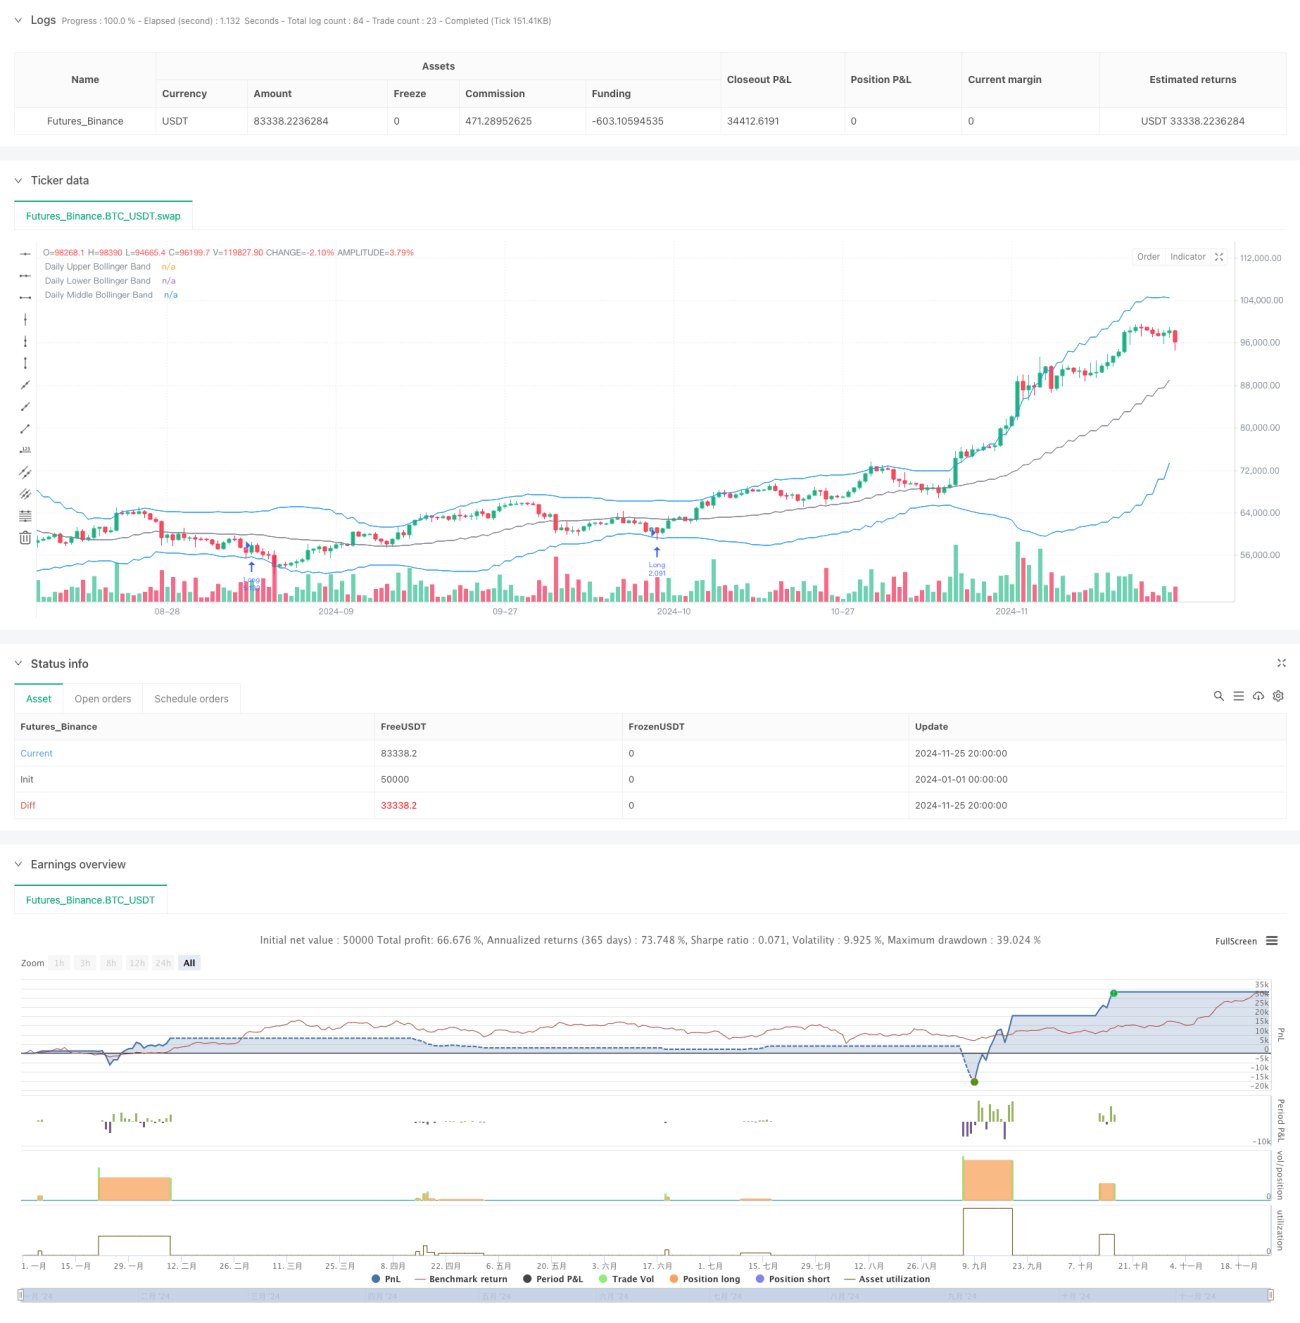
/*backtest
start: 2024-01-01 00:00:00
end: 2024-11-26 00:00:00
period: 12h
basePeriod: 12h
exchanges: [{"eid":"Futures_Binance","currency":"BTC_USDT"}]
*/

//@version=5
strategy("Trade Entry Detector, based on Wick to Body Ratio when price tests Bollinger Bands", overlay=true, default_qty_type=strategy.fixed)

// Input for primary analysis time frame- 1