
Tổng quan
Đây là một chiến lược giao dịch định lượng dựa trên ba chỉ số kỹ thuật VWAP, MACD và RSI. Chiến lược này xác định các cơ hội mua và bán trên thị trường bằng cách kết hợp các tín hiệu đa dạng của giá trung bình trọng lượng giao dịch (VWAP), chỉ số phân tán xu hướng trung bình di chuyển (MACD) và chỉ số tương đối mạnh (RSI). Chiến lược này sử dụng cơ chế dừng lỗ phần trăm để quản lý rủi ro và sử dụng quản lý vị trí chiến lược để tối ưu hóa sử dụng vốn.
Nguyên tắc chiến lược
Lập luận cốt lõi của chiến lược dựa trên phân tích tổng hợp ba chỉ số chính:
- Sử dụng VWAP như là đường tham chiếu xu hướng chính, xem xét khi giá vượt qua VWAP là tín hiệu chuyển hướng tiềm năng
- Biểu đồ cột MACD được sử dụng để xác nhận cường độ và hướng của xu hướng, giá trị tích cực cho thấy xu hướng tăng, giá trị âm cho thấy xu hướng giảm
- RSI được sử dụng để xác định thị trường có đang quá mua hay quá bán để tránh tham gia vào các tình huống cực đoan
Điều kiện mua hàng là:
- Giá vượt VWAP
- Bảng MACD trục trặc
- RSI chưa đạt mức mua quá mức
Các điều kiện bán hàng phải được đáp ứng:
- Giá giảm vượt qua VWAP
- Biểu đồ MACD âm
- RSI chưa đạt mức bán tháo
Lợi thế chiến lược
- Xác thực chéo nhiều chỉ số kỹ thuật để tăng độ tin cậy tín hiệu
- Tiếp theo, các nhà đầu tư có thể sử dụng các công cụ phân tích thị trường khác nhau để phân tích thị trường.
- Sử dụng RSI để lọc các hoạt động cực đoan và giảm nguy cơ phá vỡ giả
- Sử dụng tỷ lệ phần trăm Stop Loss, động thích ứng với các phạm vi giá khác nhau
- Position sizing dựa trên tỷ lệ giá trị ròng của tài khoản, thực hiện quản lý vị trí động
- Lập luận chiến lược rõ ràng, dễ hiểu và dễ duy trì
Rủi ro chiến lược
- Thị trường bất ổn có thể dẫn đến giao dịch thường xuyên và tăng chi phí giao dịch
- Nhiều chỉ số có thể làm chậm tín hiệu và ảnh hưởng đến thời gian nhập cảnh
- Tỷ lệ dừng cố định có thể không phù hợp với tất cả các môi trường thị trường
- Không tính đến biến động của thị trường, có thể làm tăng rủi ro trong thời gian biến động cao
- Thiếu bộ lọc cường độ xu hướng, có thể tạo ra quá nhiều tín hiệu trong thị trường xu hướng yếu
Hướng tối ưu hóa chiến lược
- Nhập ATR động điều chỉnh stop loss để thích ứng tốt hơn với biến động của thị trường
- Thêm bộ lọc cường độ xu hướng để giảm tín hiệu giả của thị trường rung chuyển
- Tối ưu hóa thiết lập chu kỳ VWAP, có thể xem xét các kết hợp VWAP nhiều chu kỳ
- Tiếp theo, hệ thống xác nhận giao dịch được giới thiệu để tăng độ tin cậy tín hiệu đột phá.
- Xem xét thêm bộ lọc thời gian để tránh giao dịch trong thời gian thiếu thanh khoản
- Cơ chế kích thước vị trí có khả năng điều chỉnh động, điều chỉnh kích thước vị trí theo điều kiện thị trường
Tóm tắt
Chiến lược này xây dựng một hệ thống giao dịch tương đối hoàn chỉnh bằng cách sử dụng tổng hợp ba chỉ số kỹ thuật cổ điển VWAP, MACD và RSI. Chiến lược được thiết kế để tập trung vào độ tin cậy và quản lý rủi ro của tín hiệu, cải thiện chất lượng giao dịch thông qua xác minh chéo đa chỉ số. Mặc dù có một số khía cạnh cần được tối ưu hóa, nhưng khung tổng thể hợp lý và có khả năng mở rộng tốt.
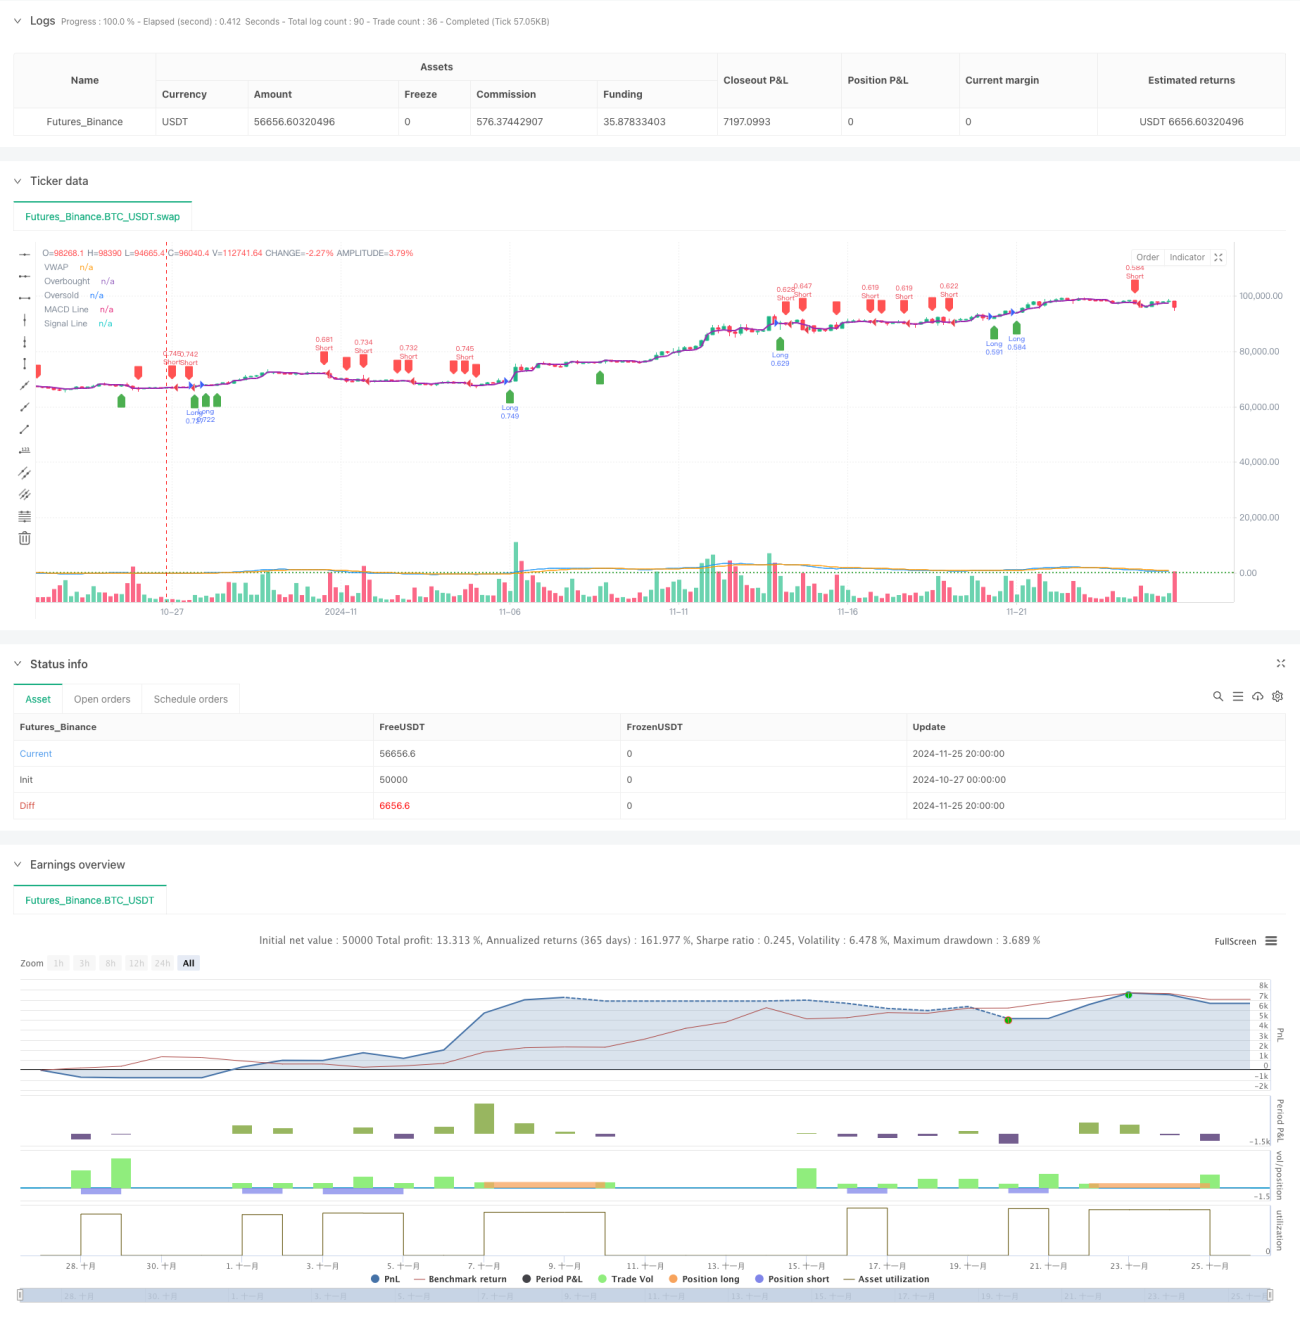
/*backtest
start: 2024-10-27 00:00:00
end: 2024-11-26 00:00:00
period: 4h
basePeriod: 4h
exchanges: [{"eid":"Futures_Binance","currency":"BTC_USDT"}]
*/

//@version=5
strategy("pbs", overlay=true, default_qty_type=strategy.percent_of_equity, default_qty_value=100)

// Input for take-profit and stop-loss- 1