Chiến lược theo dõi xu hướng đa giai đoạn và quản lý biến động ATR

Tổng quan
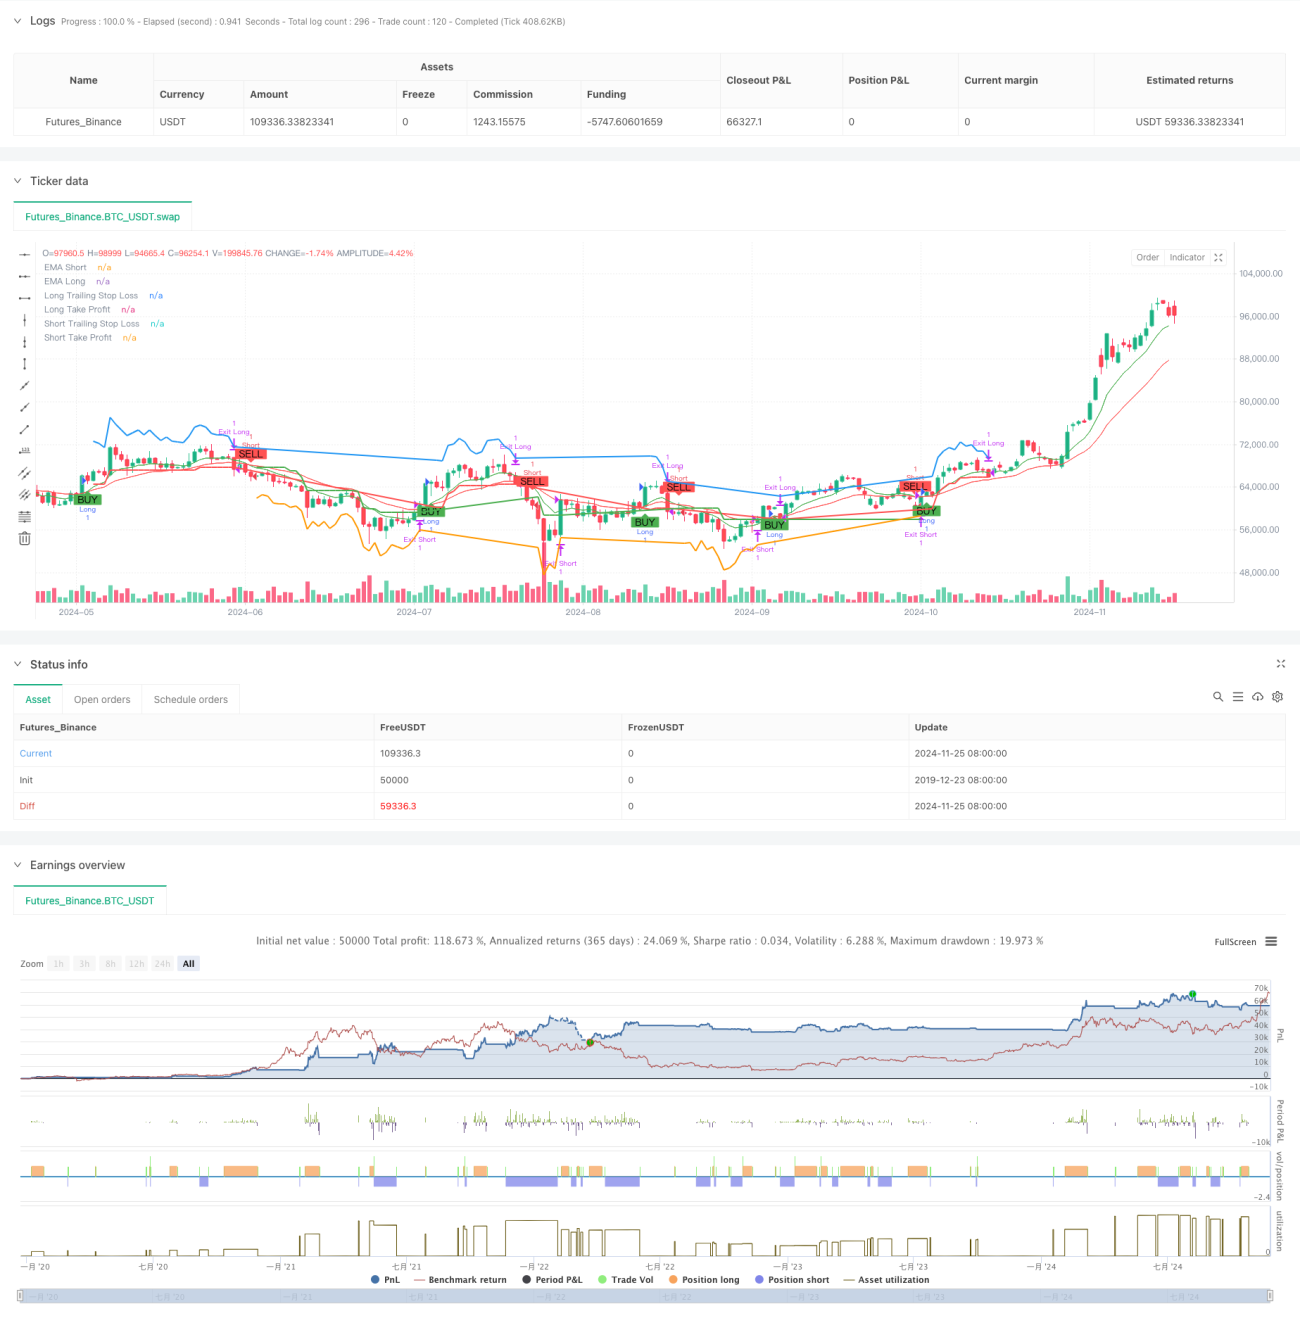
Đây là một chiến lược theo dõi xu hướng kết hợp phân tích đa chu kỳ và quản lý biến động. Cốt lõi của chiến lược là sử dụng định hướng xu hướng của phán đoán chéo hai đường ngang, lọc quá mua quá bán thông qua chỉ số RSI, giới thiệu thời gian cao hơn chu kỳ EMA xác nhận xu hướng tổng thể và sử dụng chỉ số ATR để quản lý động lực dừng lỗ và mục tiêu thu lợi nhuận.
Nguyên tắc chiến lược
Lịch lý giao dịch cốt lõi của chiến lược được chia thành các phần quan trọng sau:
- Nhận biết xu hướng: Sử dụng giao thoa của EMA ngắn và dài để nhận biết sự thay đổi xu hướng, tạo ra tín hiệu đa khi đeo EMA dài trên EMA ngắn, tạo ra tín hiệu trống khi đeo EMA dài.
- Xác nhận xu hướng: giới thiệu EMA ở thời gian cao hơn làm bộ lọc xu hướng, chỉ cho phép làm nhiều hơn khi giá nằm trên EMA ở thời gian cao, và ngược lại cho phép làm trống.
- Bộ lọc tỷ lệ biến động: Sử dụng chỉ số RSI để đánh giá quá mua quá bán, để ngăn chặn việc tham gia vào trường hợp giảm giá quá mức.
- Quản lý vị trí: Đặt mục tiêu dừng lỗ và lợi nhuận động dựa trên ATR, tự động điều chỉnh vị trí dừng lỗ khi giá thay đổi, bảo vệ cả lợi nhuận và lợi nhuận.
- Bảo vệ đa chiều: Chiến lược xây dựng một hệ thống quyết định giao dịch hoàn chỉnh thông qua việc sử dụng tổng hợp nhiều chỉ số kỹ thuật.
Lợi thế chiến lược
- Tín hiệu đáng tin cậy: Tín hiệu giao dịch được cải thiện đáng kể thông qua việc sử dụng nhiều chỉ số kỹ thuật.
- Kiểm soát rủi ro hoàn hảo: Sử dụng chương trình dừng động dựa trên ATR, có thể điều chỉnh vị trí dừng tùy theo biến động của thị trường.
- Xu hướng chính xác: Sử dụng phương pháp phân tích đa chu kỳ, tăng độ chính xác trong việc đánh giá các xu hướng chính.
- Mục tiêu lợi nhuận linh hoạt: Cài đặt take-profit cũng dựa trên điều chỉnh động ATR, trong khi đảm bảo lợi nhuận sẽ không ra đi quá sớm.
- Khả năng thích ứng: Các tham số chiến lược có thể được điều chỉnh để thích ứng với các môi trường thị trường khác nhau.
Rủi ro chiến lược
- Rủi ro thị trường biến động: Các giao dịch thường xuyên có thể dẫn đến tổn thất trong tình huống biến động ngang.
- Rủi ro trượt giá: Trong thời kỳ biến động mạnh, giá giao dịch thực tế có thể có sai lệch lớn so với giá lý thuyết.
- Rủi ro phá vỡ giả: Có thể xảy ra sự đảo ngược sau một lần phá vỡ ngắn hạn, dẫn đến dừng lỗ.
- Tính nhạy cảm của tham số: Các kết hợp tham số khác nhau có ảnh hưởng lớn đến hiệu suất của chiến lược và cần được thử nghiệm đầy đủ.
Hướng tối ưu hóa chiến lược
- Nhận biết môi trường thị trường: Bạn có thể thêm các chỉ số cường độ xu hướng, tự động giảm vị trí hoặc tạm dừng giao dịch trong thị trường biến động.
- Tối ưu hóa thời gian nhập cảnh: có thể kết hợp các chỉ số khối lượng giao thông để cải thiện độ tin cậy của tín hiệu nhập cảnh.
- Điều chỉnh tham số động: có thể tự động điều chỉnh chu kỳ EMA và ATR theo biến động thị trường.
- Lựa chọn xây dựng kho hàng loạt: Có thể thiết kế cơ chế xây dựng kho hàng loạt và giảm kho hàng để giảm rủi ro của một điểm giá duy nhất.
- Tối ưu hóa quản lý vị trí: có thể điều chỉnh quy mô giữ vị trí dựa trên rủi ro tài khoản và biến động của thị trường.
Tóm tắt
Đây là một chiến lược theo dõi xu hướng được thiết kế hoàn hảo, có đặc điểm lợi nhuận rủi ro tốt hơn thông qua phân tích đa chu kỳ và quản lý biến động. Ưu điểm cốt lõi của chiến lược là kết hợp hữu cơ của nhiều chỉ số kỹ thuật, đảm bảo độ tin cậy của giao dịch và kiểm soát rủi ro hiệu quả. Mặc dù có một số rủi ro tiềm ẩn, nhưng với sự tối ưu hóa và hoàn thiện liên tục, hiệu suất tổng thể của chiến lược vẫn có thể được cải thiện.
- 1