Theo dõi xu hướng chéo đa chỉ báo và chiến lược giao dịch thích ứng kết hợp khối lượng và giá

Tổng quan
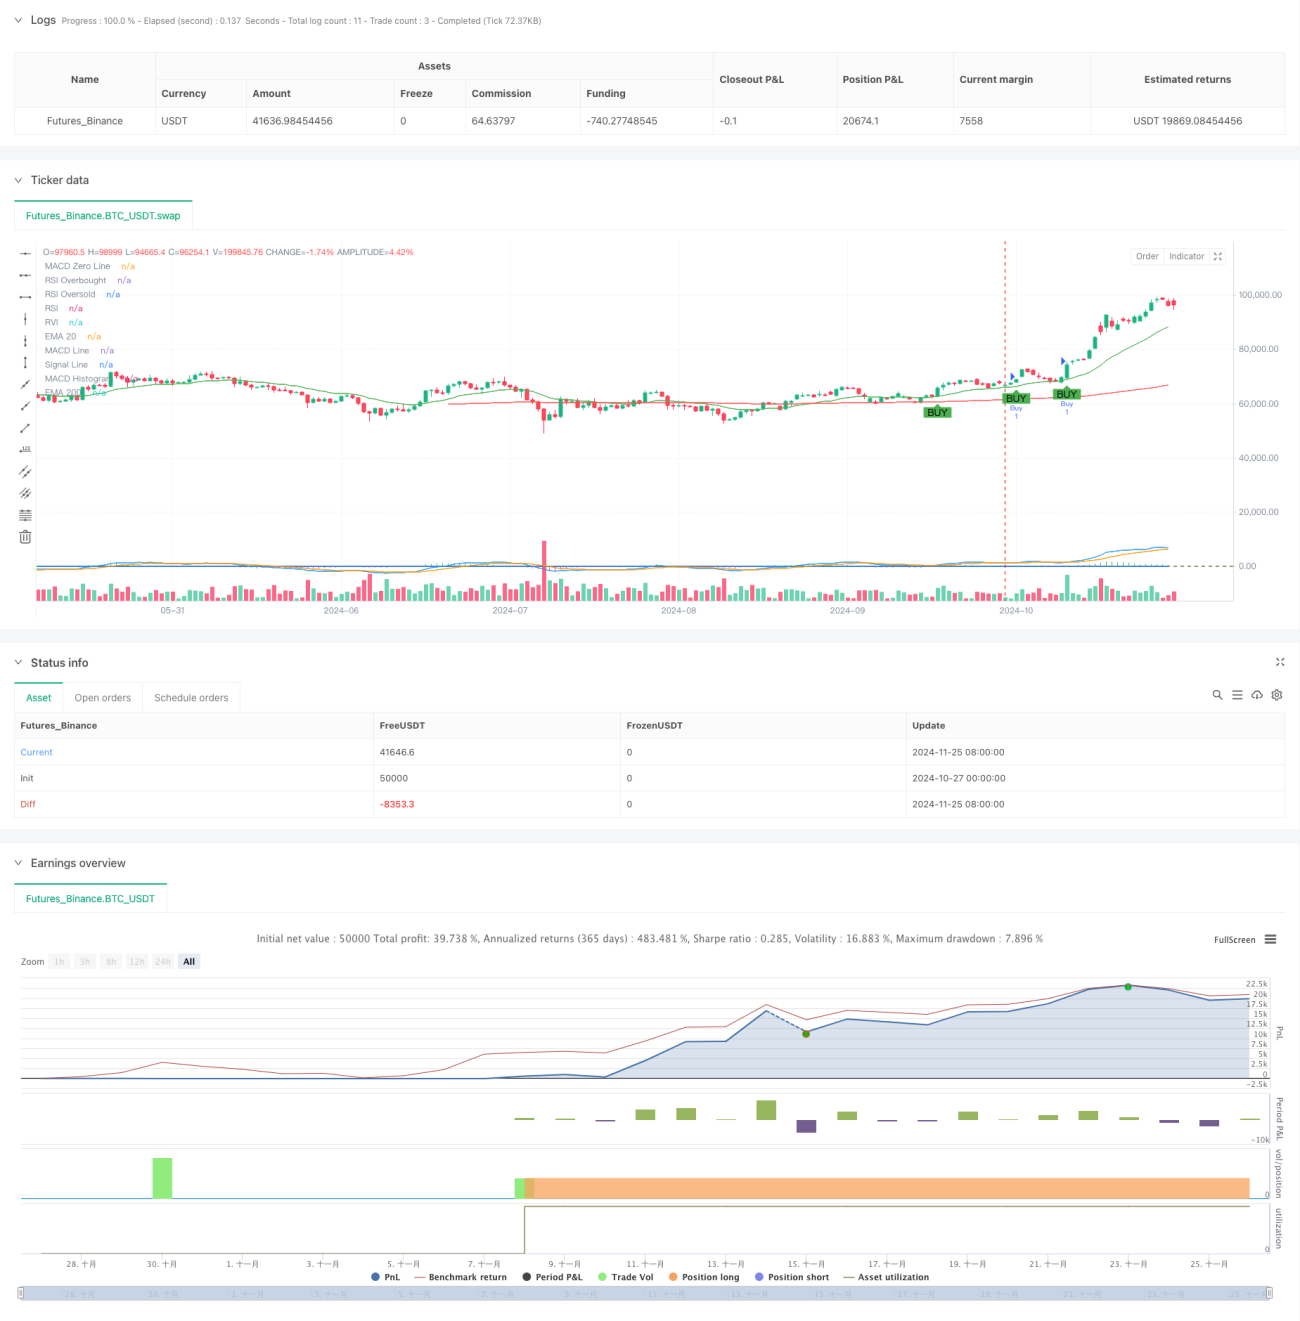
Chiến lược này là một hệ thống giao dịch theo dõi xu hướng kết hợp nhiều chỉ số kỹ thuật, xác định xu hướng thị trường thông qua các tín hiệu chéo của các chỉ số như MACD, RSI, RVI, EMA và xác nhận khối lượng giao dịch và sử dụng theo dõi dừng để quản lý rủi ro. Chiến lược hoạt động trong một phạm vi giá cụ thể để tăng độ chính xác và độ tin cậy của giao dịch bằng cách đánh giá tổng hợp nhiều tín hiệu.
Nguyên tắc chiến lược
Chiến lược này sử dụng cơ chế xác minh tín hiệu nhiều cấp, bao gồm một số thành phần quan trọng như sau: đầu tiên, sử dụng đường trung bình di chuyển chỉ số ((EMA) 20 chu kỳ và 200 chu kỳ để xác định xu hướng thị trường tổng thể; thứ hai, sử dụng đường chéo của MACD ((12,26,9) để nắm bắt điểm biến của xu hướng; thứ ba, sử dụng đường chỉ số tương đối mạnh ((RSI) và đường chỉ số tương đối dao động ((RVI) để xác nhận tình trạng quá mua quá bán của thị trường; cuối cùng, xác nhận giao dịch bằng chỉ số giao dịch.
Lợi thế chiến lược
- Cơ chế xác thực đa tín hiệu giảm đáng kể nguy cơ đột nhập giả
- Kết hợp theo dõi xu hướng và chỉ số biến động để duy trì sự ổn định trong các môi trường thị trường khác nhau
- Tăng độ tin cậy tín hiệu giao dịch thông qua xác nhận khối lượng giao dịch
- Chế độ Tracking Stop Loss có thể bảo vệ lợi nhuận đã đạt được một cách hiệu quả
- Giới hạn phạm vi giá có thể giúp tránh giao dịch quá mức trong các trường hợp cực đoan
- Các tham số chỉ số có thể được điều chỉnh linh hoạt theo tình hình thị trường
- Hệ thống có khả năng mở rộng và thích ứng tốt
Rủi ro chiến lược
- Nhiều điều kiện có thể khiến bạn bỏ lỡ cơ hội giao dịch quan trọng
- Các tín hiệu sai có thể xảy ra thường xuyên trong thị trường dao động ngang
- Các giới hạn về phạm vi giá cố định có thể khiến các chiến lược bỏ lỡ những cơ hội đột phá quan trọng
- Sự phụ thuộc quá nhiều vào các chỉ số kỹ thuật có thể bỏ qua những yếu tố cơ bản
- Tracking Stop có thể được kích hoạt quá sớm khi biến động mạnh
Hướng tối ưu hóa chiến lược
- Tiến hành cơ chế tham số thích ứng, điều chỉnh các tham số chỉ số theo biến động của thị trường
- Tham gia vào chỉ số cảm xúc thị trường, nâng cao khả năng dự đoán các điểm biến chuyển của thị trường
- Phát triển các cơ chế phán quyết giá động, giúp chiến lược linh hoạt hơn
- Tăng bộ lọc chu kỳ thời gian để tránh giao dịch trong thời gian bất lợi
- Tối ưu hóa cơ chế dừng lỗ, xem xét giới thiệu dừng lỗ động dựa trên tỷ lệ biến động
- Thêm mô-đun quản lý rủi ro để quản lý vị trí tốt hơn
Tóm tắt
Chiến lược này xây dựng một hệ thống giao dịch tương đối hoàn chỉnh thông qua việc sử dụng kết hợp nhiều chỉ số kỹ thuật. Mặc dù có một số hạn chế, chiến lược có giá trị thực tế tốt thông qua tối ưu hóa tham số và quản lý rủi ro hợp lý. Trong tương lai, có thể nâng cao tính ổn định và lợi nhuận của chiến lược bằng cách giới thiệu nhiều cơ chế tự điều chỉnh và phương tiện kiểm soát rủi ro hơn.
- 1