
Tổng quan
Chiến lược này là một hệ thống giao dịch cao cấp kết hợp nhiều công cụ phân tích kỹ thuật để tạo ra tín hiệu giao dịch dựa trên các mức độ Fibonacci rút lui của khung thời gian cao và các điều kiện phá vỡ giá cao và thấp hơn. Chiến lược này tính toán động dữ liệu giá của khung thời gian cao hơn, kết hợp các mức độ Fibonacci rút lui và điều kiện phá vỡ giá tùy chỉnh để tạo thành một hệ thống quyết định giao dịch hoàn chỉnh. Phương pháp này xem xét cả xu hướng tổng thể của thị trường và chú ý đến các đợt phá vỡ giá ngắn hạn, có thể nắm bắt các cơ hội giao dịch tiềm năng tại các điểm biến chuyển của thị trường.
Nguyên tắc chiến lược
Logic cốt lõi của chiến lược được xây dựng dựa trên ba trụ cột chính: phân tích giá trên các khung thời gian cao hơn, xây dựng quan điểm thị trường vĩ mô hơn bằng cách tính toán giá mở và giá khép lại của các chu kỳ thời gian cao hơn như đường ngày. Tiếp theo là tính toán động của mức Fibonacci retraction, thiết lập các ngưỡng kháng cự quan trọng dựa trên các vùng giá trên khung thời gian cao.
Lợi thế chiến lược
- Phân tích đa chiều: kết hợp một số yếu tố được công nhận nhất trong phân tích kỹ thuật, bao gồm hành vi giá, theo dõi xu hướng và kháng cự hỗ trợ.
- Khả năng thích ứng: Các tham số có thể được điều chỉnh theo các điều kiện thị trường khác nhau, bao gồm chu kỳ thời gian, thời gian hồi quy và mức Fibonacci.
- Quản lý rủi ro tốt hơn: Giảm nguy cơ đột phá giả mạo thông qua cơ chế xác nhận nhiều lần.
- Khả năng hiển thị cao: Tất cả các mức giá quan trọng được hiển thị rõ ràng trên biểu đồ, giúp các quyết định giao dịch dễ dàng hơn.
- Tính linh hoạt: Có thể áp dụng cho nhiều loại giao dịch và khoảng thời gian.
Rủi ro chiến lược
- Tính nhạy cảm của tham số: các thiết lập thời gian hồi quy khác nhau có thể gây ra sự khác biệt lớn về chất lượng tín hiệu.
- Tùy thuộc vào điều kiện thị trường: Có thể có quá nhiều tín hiệu giả trong thị trường biến động.
- Rủi ro bị tụt hậu: Có thể bỏ lỡ điểm vào tốt nhất trong thị trường nhanh chóng vì sử dụng dữ liệu quay ngược.
- Rủi ro quá tối ưu hóa: quá tối ưu hóa các tham số có thể dẫn đến hiệu suất kém trong tương lai.
Hướng tối ưu hóa chiến lược
- Tăng bộ lọc tỷ lệ biến động: khuyến nghị thêm các chỉ số như ATR hoặc Bollinger Bandwidth để lọc các giai đoạn biến động thấp.
- Bộ lọc xu hướng tích hợp: có thể tham gia vào hệ thống đồng tuyến để xác nhận hướng xu hướng tổng thể.
- Tối ưu hóa thời gian ra sân: có thể kết hợp với các chỉ số động lực như RSI để cải thiện thời gian ra sân.
- Điều chỉnh tham số động: giới thiệu cơ chế thích ứng, tự động điều chỉnh tham số theo tình trạng thị trường.
- Tăng cường kiểm soát rủi ro: Thêm thiết lập mục tiêu dừng lỗ và lợi nhuận động.
Tóm tắt
Đây là một hệ thống giao dịch được thiết kế tốt, tạo ra một chiến lược giao dịch thực tế bằng cách kết hợp nhiều công cụ phân tích kỹ thuật cổ điển. Đặc điểm lớn nhất của chiến lược này là có thể cung cấp tín hiệu giao dịch đáng tin cậy hơn thông qua phân tích đa chiều, trong khi vẫn có đủ tính linh hoạt để thích ứng với các môi trường thị trường khác nhau. Mặc dù có một số rủi ro vốn có, nhưng bằng hướng tối ưu hóa được đề xuất, bạn có thể nâng cao hơn nữa sự ổn định và độ tin cậy của chiến lược.
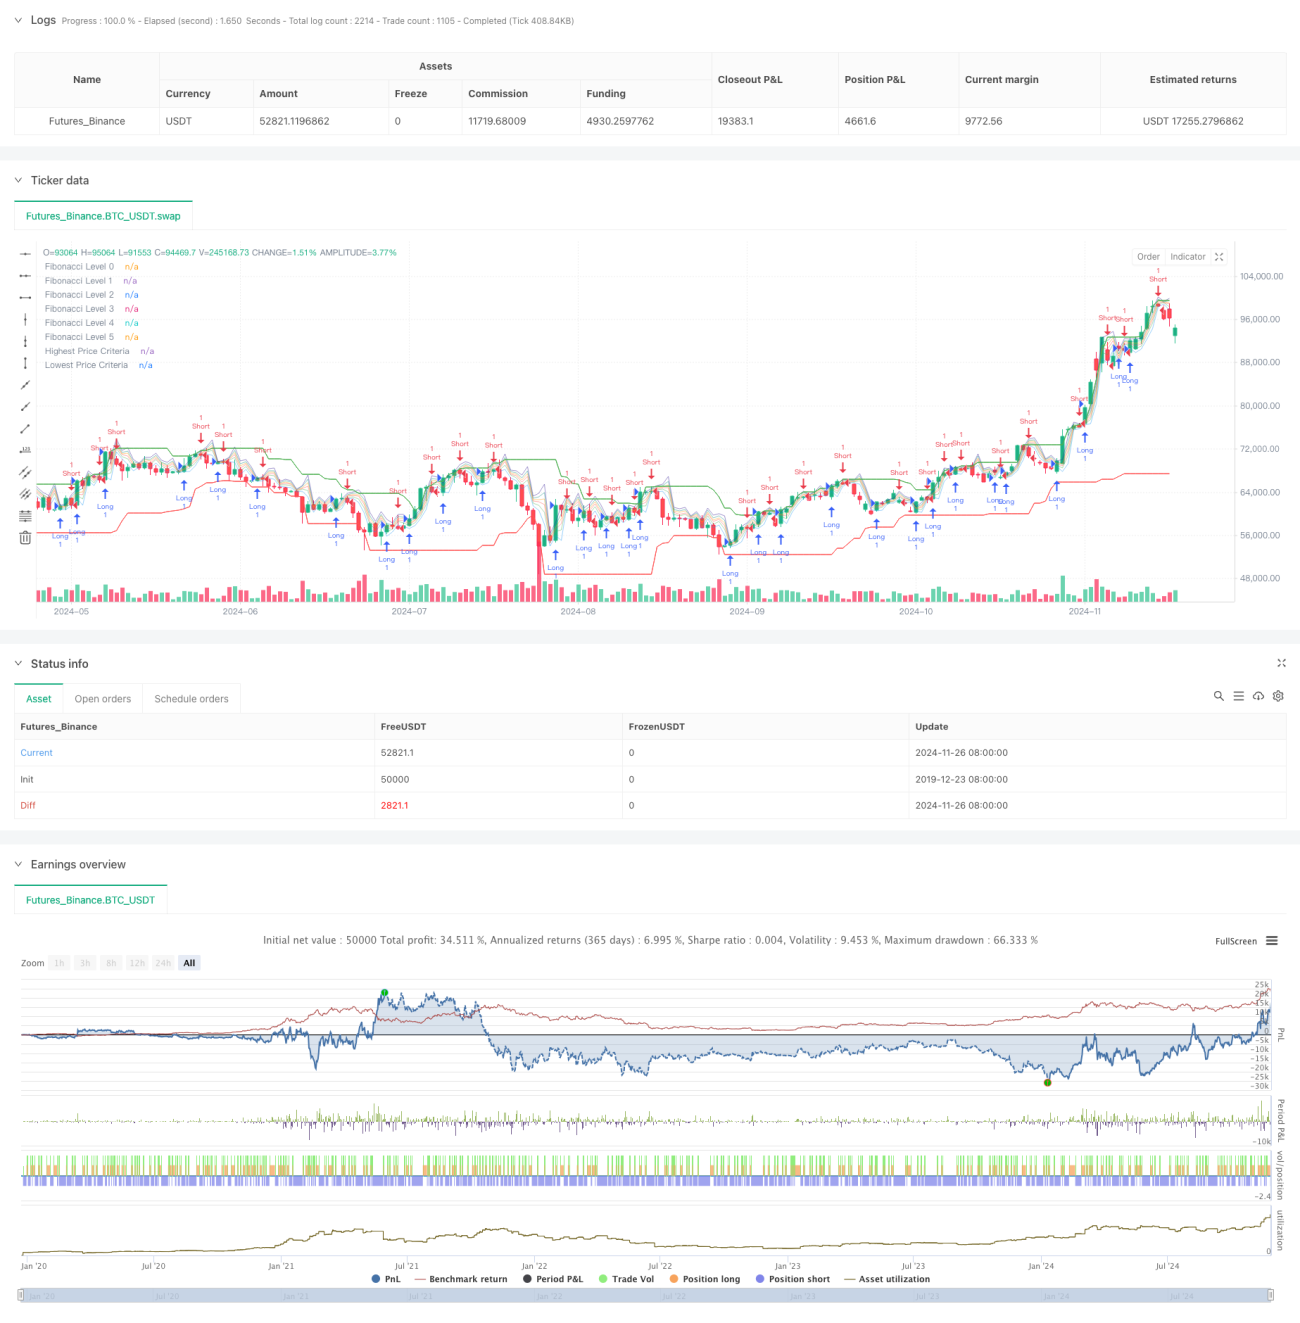
/*backtest
start: 2019-12-23 08:00:00
end: 2024-11-27 00:00:00
period: 1d
basePeriod: 1d
exchanges: [{"eid":"Futures_Binance","currency":"BTC_USDT"}]
*/

//@version=5
strategy("Fibonacci Levels Strategy with High/Low Criteria", overlay = true)

// Kullanıcıdan yüksek zaman dilimini ve mum bilgilerini al- 1