Ba chiến lược giao dịch theo dõi đường trung bình động kết hợp với dừng lỗ và dừng lãi động

Tổng quan
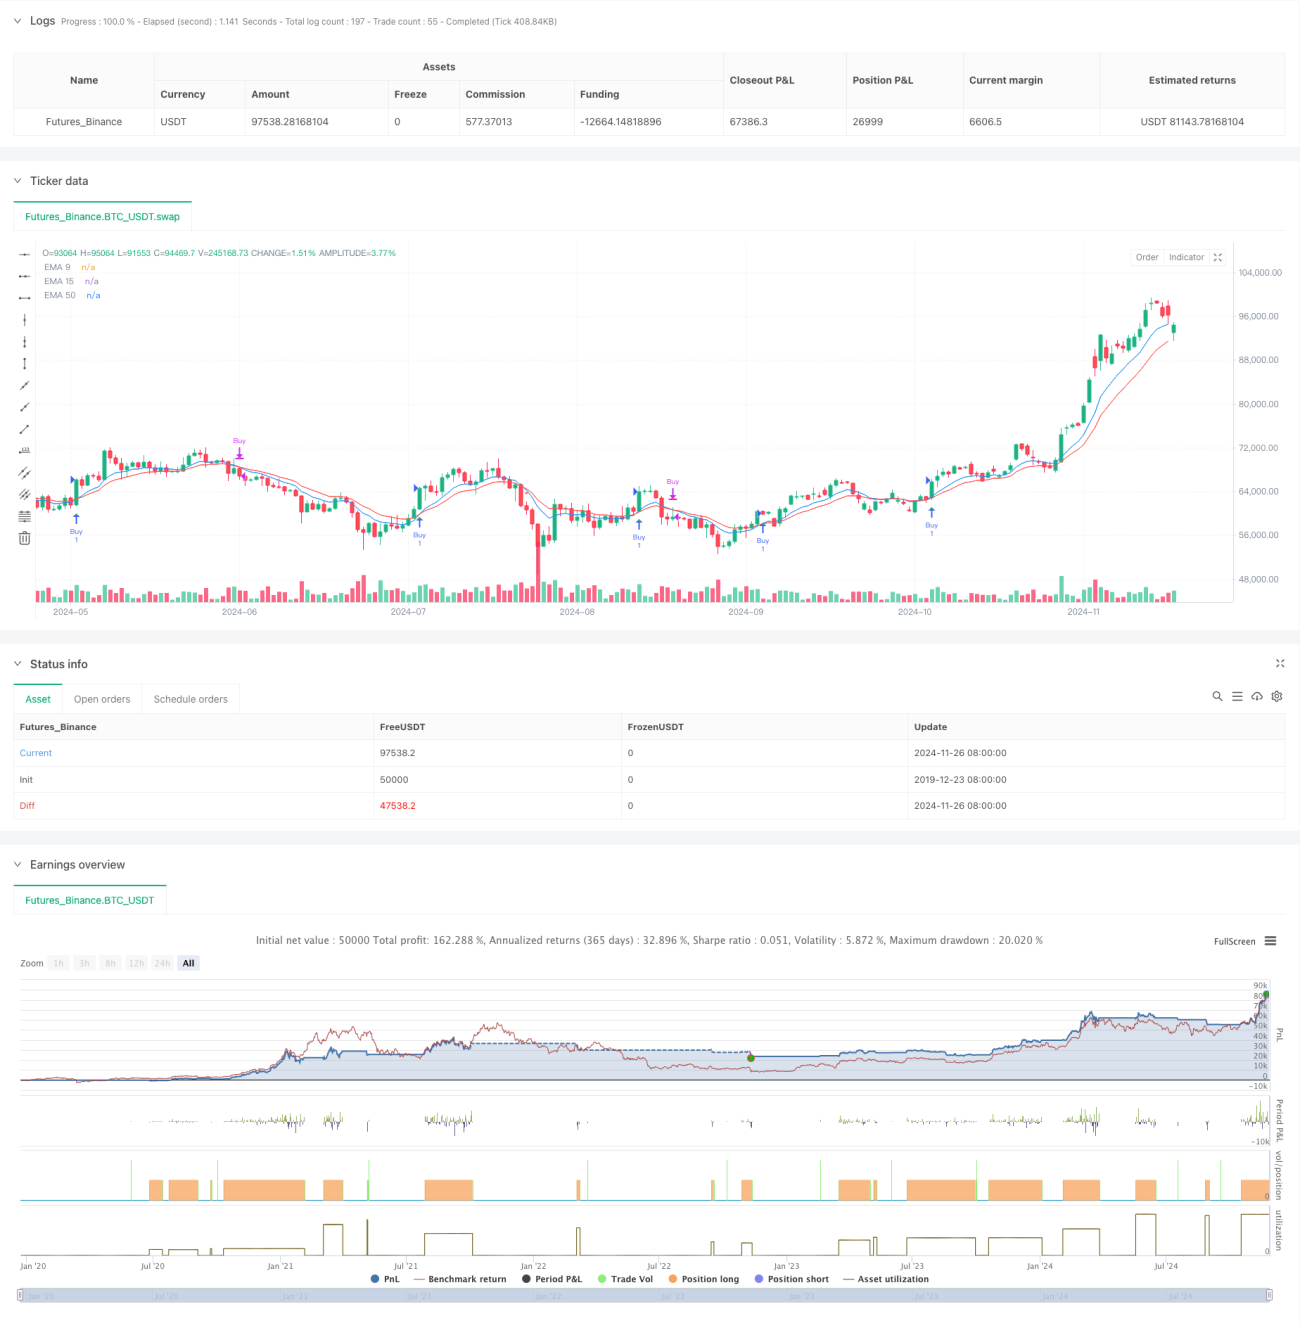
Đây là một chiến lược theo dõi xu hướng dựa trên tín hiệu chéo của đường trung bình di chuyển ba chỉ số ((EMA)). Chiến lược này sử dụng các chỉ số EMA 9 chu kỳ, 15 chu kỳ và 50 chu kỳ để đánh giá các tín hiệu chéo của đường trung bình ngắn hạn và đường trung bình trung hạn, kết hợp với đường trung bình dài hạn làm bộ lọc xu hướng, đồng thời kết hợp với cơ chế dừng lỗ động để quản lý rủi ro giao dịch. Chiến lược này được thiết kế để đáp ứng đầy đủ nhu cầu theo dõi xu hướng và quản lý rủi ro, phù hợp với giao dịch trung hạn dài hạn.
Nguyên tắc chiến lược
Lý luận cốt lõi của chiến lược là xác định thời gian giao dịch bằng cách theo dõi tín hiệu chéo của EMA 9 chu kỳ với EMA 15 chu kỳ và sử dụng EMA 50 chu kỳ làm chỉ số xác nhận xu hướng. Cụ thể:
- Khi giá nằm trên 50 chu kỳ EMA và 9 chu kỳ EMA đi lên vượt qua 15 chu kỳ EMA, hệ thống tạo ra tín hiệu đa
- Khi giá nằm dưới 50 chu kỳ EMA và 9 chu kỳ EMA đi xuống vượt qua 15 chu kỳ EMA, hệ thống tạo ra tín hiệu ngang
- Mỗi giao dịch đều có điểm dừng cố định và mục tiêu thu lợi nhuận để bảo vệ tiền và khóa lợi nhuận
- Hệ thống thông qua chức năng cảnh báo phát ra cảnh báo khi có tín hiệu giao dịch, giúp thương nhân xử lý kịp thời
Lợi thế chiến lược
- Cơ chế xác nhận đa dạng: giảm nguy cơ đột phá giả hiệu quả bằng cách sử dụng kết hợp ba đường thẳng
- Khả năng theo dõi xu hướng mạnh mẽ: 50 vòng EMA có vai trò lọc đảm bảo hướng giao dịch phù hợp với xu hướng chính
- Quản lý rủi ro hoàn hảo: mục tiêu dừng lỗ và lợi nhuận được xây dựng để kiểm soát hiệu quả rủi ro cho mỗi giao dịch
- Tín hiệu rõ ràng: tín hiệu chéo rõ ràng, dễ dàng thực hiện
- Mức độ tự động hóa cao: hỗ trợ giao dịch tự động và nhắc nhở, giảm can thiệp của con người
- Các tham số có thể điều chỉnh: Các tham số chính có thể được tối ưu hóa theo các đặc điểm thị trường khác nhau
Rủi ro chiến lược
- Rủi ro của thị trường chấn động: có thể tạo ra các tín hiệu sai thường xuyên trong giai đoạn sắp xếp ngang
- Rủi ro độ trễ: Đường trung bình động có độ trễ và bạn có thể bỏ lỡ thời điểm vào lệnh tốt nhất.
- Rủi ro dừng cố định: dừng tại điểm cố định có thể không thích nghi với sự biến động của thị trường
- Sự phụ thuộc quá nhiều vào các chỉ số kỹ thuật: không tính đến các yếu tố cơ bản có thể dẫn đến sai lầm trong phán đoán về các bước ngoặt quan trọng
- Rủi ro quản lý tiền: Nếu đặt mục tiêu dừng lỗ và lợi nhuận không hợp lý, có thể ảnh hưởng đến tỷ lệ lợi nhuận tổng thể
Hướng tối ưu hóa chiến lược
- Tối ưu hóa dừng động: có thể giới thiệu chỉ số ATR để động điều chỉnh vị trí dừng để phù hợp hơn với đặc điểm biến động của thị trường
- Tăng cường lọc tín hiệu: có thể thêm các chỉ số phụ trợ như lưu lượng giao thông, RSI để lọc tín hiệu giả
- Các tham số tự thích ứng: có thể tự động điều chỉnh chu kỳ đường trung bình theo biến động của thị trường, tăng khả năng thích ứng chiến lược
- Tối ưu hóa giai đoạn: điều chỉnh các tham số chiến lược cho các đặc điểm thị trường trong các giai đoạn khác nhau
- Quản lý vị trí hoàn thiện: giới thiệu cơ chế quản lý vị trí động, tự động điều chỉnh số lượng vị trí mở theo mức độ rủi ro của thị trường
Tóm tắt
Đây là một chiến lược theo dõi xu hướng được thiết kế hợp lý, logic rõ ràng. Bằng cách sử dụng kết hợp của nhiều đường trung bình, cả hai đảm bảo độ tin cậy của tín hiệu và thực hiện theo dõi hiệu quả của xu hướng.
- 1