
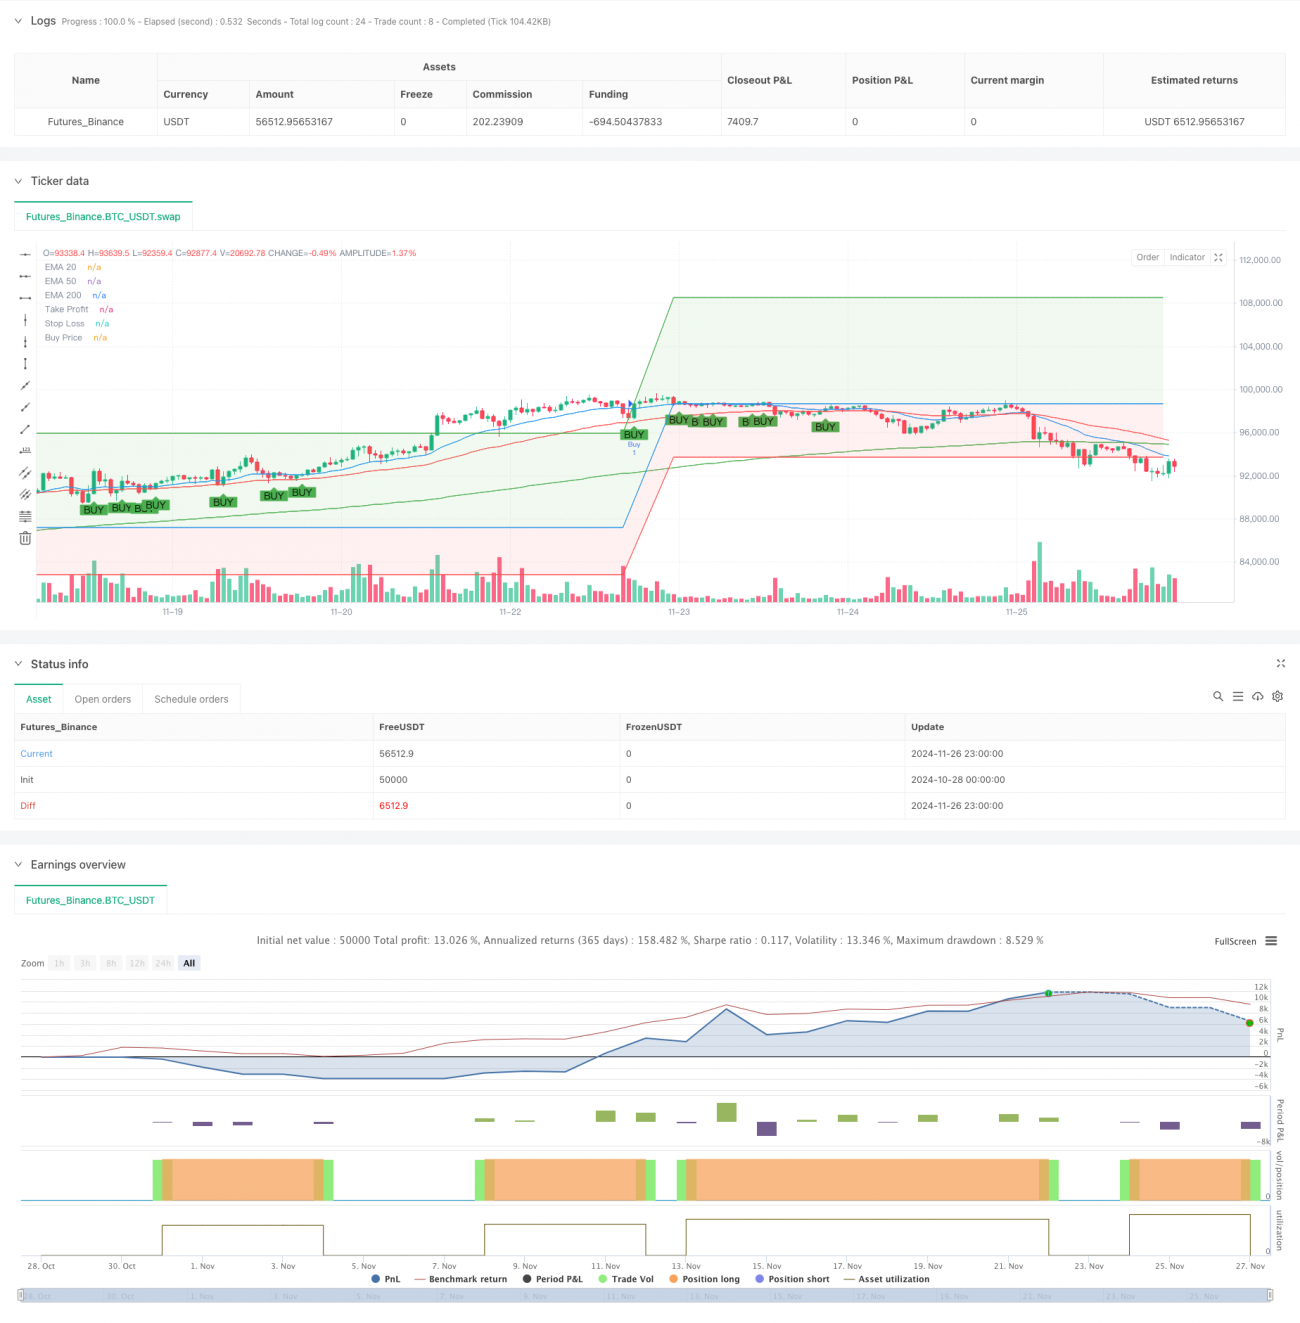
Tổng quan
Đây là một chiến lược theo dõi xu hướng dựa trên các đường trung bình nhiều chu kỳ. Chiến lược này chủ yếu dựa trên các mối quan hệ chéo của chỉ số di chuyển 20, 50 và 200 chu kỳ (EMA) để đánh giá thời gian vào thị trường và mối quan hệ của giá với đường trung bình, đồng thời thiết lập dừng lỗ dựa trên phần trăm để kiểm soát rủi ro.
Nguyên tắc chiến lược
Lập luận cốt lõi của chiến lược dựa trên hệ thống đa đường trung bình và phân tích hành vi giá cả:
- Xây dựng hệ thống đánh giá xu hướng sử dụng các đường trung bình di chuyển chỉ số với ba chu kỳ khác nhau (20, 50, 200)
- Điều kiện nhập học yêu cầu đáp ứng tất cả các điều kiện sau:
- Giá phá vỡ và đóng trên 20 chu kỳ EMA
- 20 vòng EMA nằm trên 50 vòng EMA
- 50 vòng EMA nằm trên 200 vòng EMA
- Kiểm soát rủi ro theo tỷ lệ phần trăm cố định:
- Cài đặt Stop-Loss 10% trên giá nhập cảnh
- Lệnh dừng lỗ được đặt ở mức 5% dưới giá khởi điểm.
Lợi thế chiến lược
- Tăng độ tin cậy của hệ thống xác nhận đa dạng
- Cung cấp nhiều xác thực thông qua đường trung bình ba và giá đột phá
- Tránh nhiễu tín hiệu giả
- Hệ thống kiểm soát rủi ro
- Cài đặt vị trí dừng lỗ
- Tỷ lệ rủi ro/lợi nhuận hợp lý:
- Khả năng thích nghi cao
- Có thể áp dụng cho nhiều chu kỳ thời gian
- Đặc biệt thích hợp cho giao dịch xu hướng trung và dài hạn
Rủi ro chiến lược
- Bảng giá không tốt.
- Có thể thường xuyên kích hoạt dừng lỗ trong thị trường chấn động
- Khuyến nghị sử dụng khi có xu hướng rõ ràng
- Rủi ro của sự chậm trễ
- Hệ thống trung bình có một sự chậm trễ.
- Có thể bỏ lỡ một số điểm khởi đầu.
- Hạn chế lỗ dừng cố định
- Tỷ lệ phần trăm cố định có thể không phù hợp với tất cả các môi trường thị trường
- Đề xuất điều chỉnh theo biến động của tỷ lệ dao động
Hướng tối ưu hóa chiến lược
- Giới thiệu Chỉ báo Biến động
- Sử dụng ATR động điều chỉnh dừng lỗ
- Tăng khả năng thích ứng với thị trường
- Trình lọc cường độ xu hướng tăng
- Thêm các chỉ số cường độ xu hướng như ADX
- Cải thiện chất lượng tín hiệu vào cửa
- Tối ưu hóa chu kỳ trung bình
- Điều chỉnh tham số đường trung bình theo các đặc điểm thị trường khác nhau
- Đề xuất phạm vi tối ưu hóa tham số
Tóm tắt
Đây là một chiến lược theo dõi xu hướng được thiết kế hợp lý, logic rõ ràng. Bằng cách sử dụng nhiều chỉ số kỹ thuật, cả hai đảm bảo độ tin cậy của chiến lược và cung cấp một chương trình kiểm soát rủi ro rõ ràng. Chiến lược đặc biệt phù hợp để hoạt động trên biểu đồ chu kỳ lớn, có lợi thế độc đáo để nắm bắt xu hướng trung và dài hạn.
- 1