Chiến lược giao dịch kháng cự động dựa trên phát hiện FVG kịp thời và xu hướng trung bình động

Tổng quan
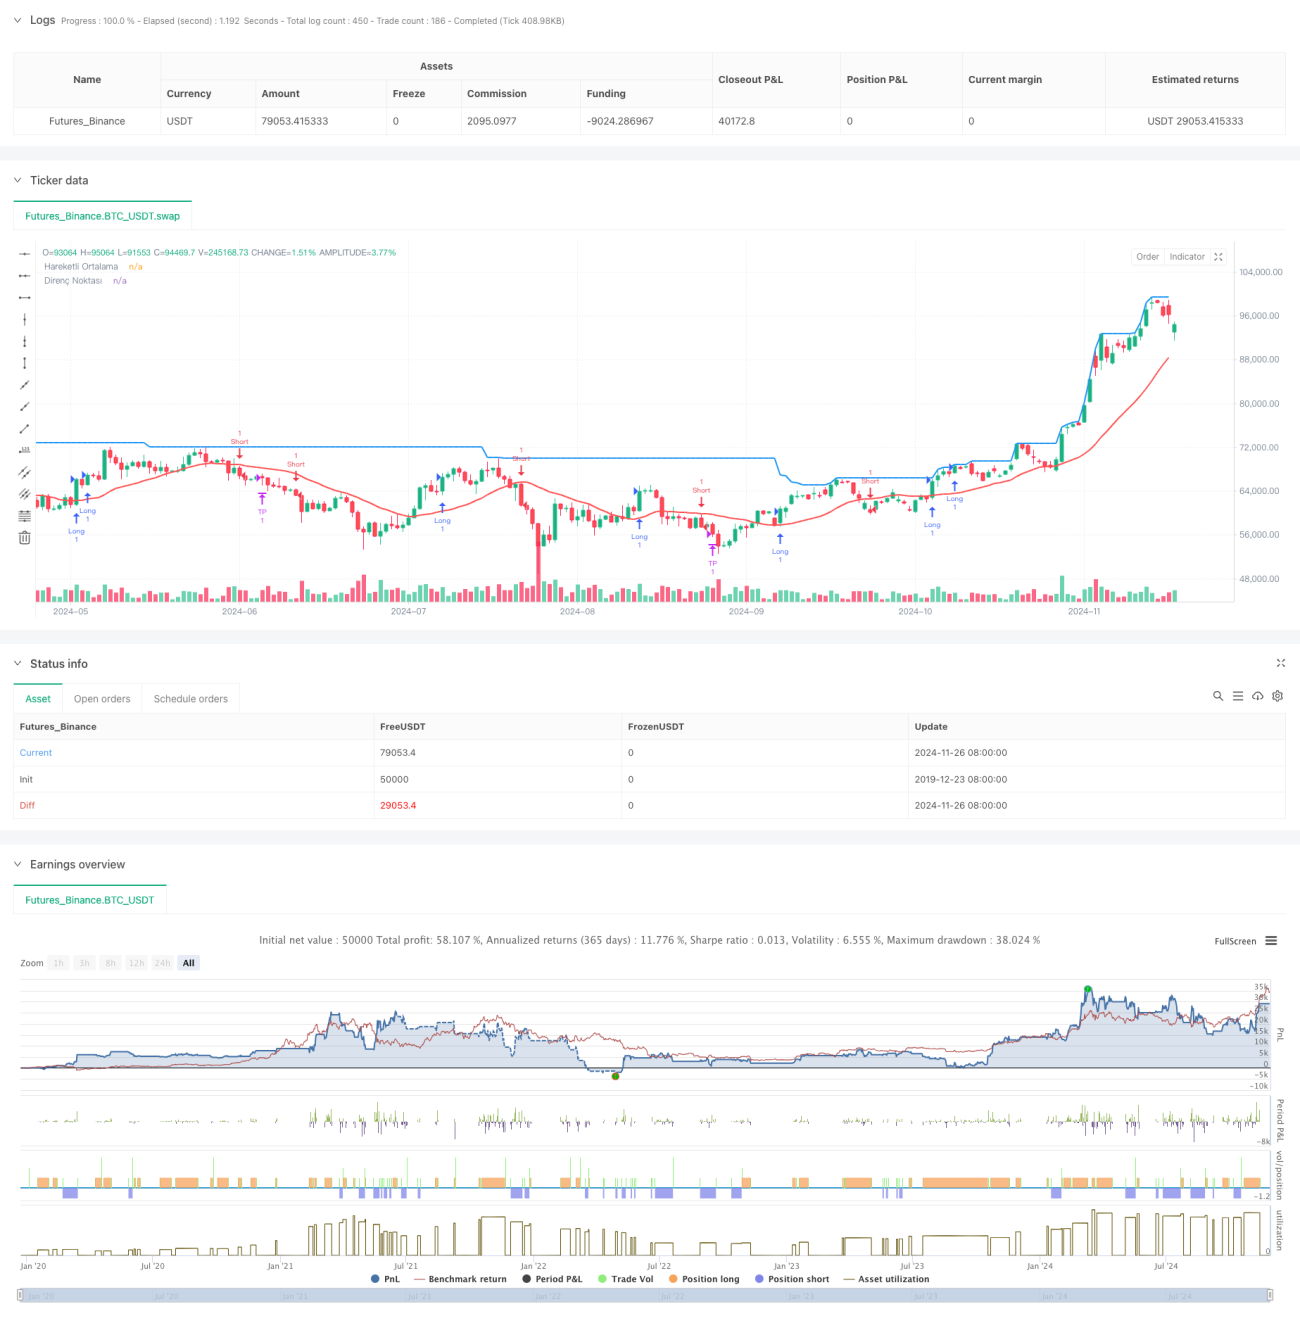
Chiến lược này là một hệ thống giao dịch tổng hợp kết hợp với phát hiện lỗ hổng giá trị công bằng (FVG), phán đoán xu hướng đường trung bình di chuyển và điểm kháng cự động. Chiến lược này giao dịch khi có tín hiệu đảo ngược bằng cách xác định sự hình thành của FVG trong các khung thời gian khác nhau và kết hợp với hướng xu hướng đường trung bình di chuyển. Hệ thống cũng bao gồm các điểm dừng động và thiết lập mục tiêu lợi nhuận dựa trên các điểm cao lịch sử.
Nguyên tắc chiến lược
Logic cốt lõi của chiến lược bao gồm những phần chính sau:
- Kiểm tra FVG: Kiểm tra lỗ hổng giá trị công bằng của nhiều đầu và đầu rỗng trong khung thời gian được chỉ định (bằng mặc định là 1 giờ)
- Xác định xu hướng: Sử dụng trung bình di chuyển 20 chu kỳ để xác định xu hướng thị trường
- Chứng nhận đảo ngược: Chánh giá tín hiệu đảo ngược thị trường bằng hình dạng đồ thị
- Động lực kháng cự: sử dụng điểm cao gần đây như điểm kháng cự và mục tiêu lợi nhuận
- Quản lý rủi ro: sử dụng chiến lược bảo vệ lỗ hổng phần trăm
Lợi thế chiến lược
- Phân tích đa chiều: kết hợp hình thức giá cả, xu hướng và cấu trúc thị trường
- Khả năng thích ứng: có thể điều chỉnh các tham số trong các môi trường thị trường khác nhau
- Có thể kiểm soát rủi ro: có thiết lập dừng lỗ và lợi nhuận rõ ràng
- Hỗ trợ hình ảnh: hiển thị đồ họa cung cấp các khu vực FVG và giá cả quan trọng
- Logic Complete: Hệ thống giao dịch hoàn chỉnh bao gồm nhập, thoát và quản lý rủi ro
Rủi ro chiến lược
- Tùy thuộc khung thời gian: Các khung thời gian khác nhau có thể tạo ra các tín hiệu xung đột
- Sự biến động của thị trường: Sự biến động mạnh có thể dẫn đến việc dừng lỗ quá thường xuyên
- Nhận thức tham số: Thiết lập tham số có ảnh hưởng lớn đến hiệu suất của chiến lược
- Xu hướng phụ thuộc: có thể kém hiệu quả trong thị trường biến động
- Tín hiệu chậm trễ: Đường trung bình di chuyển có độ chậm trễ
Hướng tối ưu hóa chiến lược
- Nhập tự điều chỉnh tỷ lệ biến động: điều chỉnh mục tiêu dừng lỗ và lợi nhuận theo biến động của thị trường
- Thêm điều kiện lọc: xác nhận số lượng giao hàng hoặc các chỉ số kỹ thuật khác
- Tối ưu hóa khung thời gian: thử nghiệm hiệu quả của các kết hợp khung thời gian khác nhau
- Cải thiện phán đoán xu hướng: Sử dụng moving average hoặc các chỉ số xu hướng khác
- Hoàn thiện xác nhận ngược: thêm nhiều phương pháp nhận dạng hình thức
Tóm tắt
Đây là một chiến lược tổng hợp kết hợp nhiều tư tưởng giao dịch để tìm kiếm cơ hội giao dịch có tỷ lệ xác suất cao thông qua sự kết hợp của FVG, xu hướng và hình dạng giá. Ưu điểm của chiến lược là có tính hệ thống mạnh mẽ, có thể kiểm soát rủi ro, nhưng cần chú ý đến việc tối ưu hóa tham số và thích ứng với môi trường thị trường.
- 1