Chiến lược giao dịch thích ứng động đa chỉ báo kỹ thuật (MTDAT)

MACD RSI BB ATR SMA SD
Ngày tạo: 2024-11-29 14:54:57 sửa đổi lần cuối: 2024-11-29 14:54:57
sao chép: 0 Số nhấp chuột: 506
1
tập trung vào
1617
Người theo dõi

Chiến lược giao dịch thích ứng động đa chỉ báo kỹ thuật (MTDAT)

Tổng quan

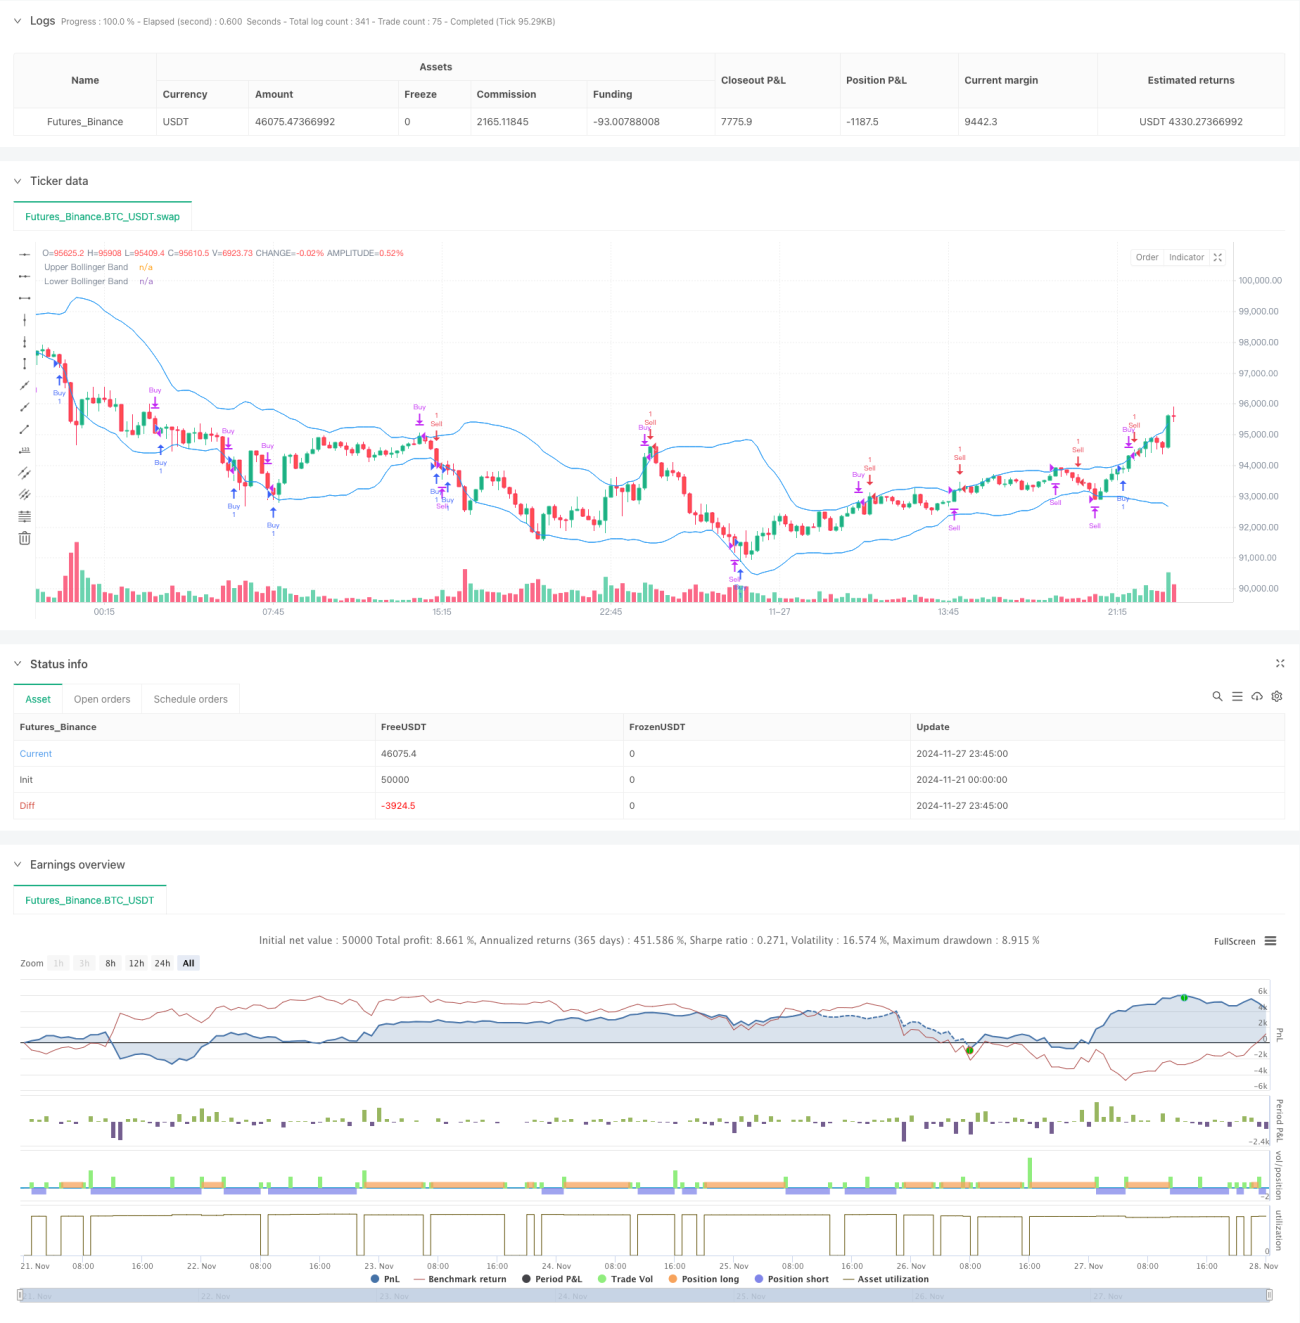
Chiến lược này là một hệ thống giao dịch tổng hợp dựa trên nhiều chỉ số kỹ thuật, kết hợp nhiều chỉ số kỹ thuật như MACD, RSI, Bollinger Bands và ATR để nắm bắt xu hướng thị trường và cơ hội đảo ngược. Chiến lược sử dụng phương án dừng lỗ và lợi nhuận động, có thể điều chỉnh các tham số giao dịch theo biến động thị trường, kiểm soát rủi ro một cách hiệu quả trong khi đảm bảo lợi nhuận. Kết quả đánh giá lại cho thấy chiến lược này đã đạt được lợi nhuận 676.27% trong thời gian thử nghiệm trong ba tháng qua, thể hiện khả năng thích ứng tốt với thị trường.

Nguyên tắc chiến lược

Chiến lược sử dụng hệ thống xác thực các chỉ số kỹ thuật đa tầng, bao gồm:

  1. MACD ((12,26,9) được sử dụng để bắt tín hiệu chuyển động động, tạo ra tín hiệu mua khi MACD trên đường đi qua đường tín hiệu và tạo ra tín hiệu bán khi đi qua đường
  2. RSI ((14) là bộ lọc thứ cấp, dưới 35 được coi là khu vực bán tháo, trên 65 được coi là khu vực mua tháo
  3. Bảng Brin ((20, 2) được sử dụng để nhận biết các khu vực dao động của giá, xem xét mua khi giá chạm đường ray xuống và bán khi chạm đường ray lên
  4. ATR được sử dụng để thiết lập các mức dừng lỗ và lợi nhuận động, dừng lỗ được đặt ở mức ATR 3 lần và mục tiêu lợi nhuận được đặt ở mức ATR 5 lần

Logic giao dịch kết hợp hai chiến lược theo dõi xu hướng và giao dịch đảo ngược, tăng độ chính xác của giao dịch thông qua xác minh nhiều lần. Hệ thống sẽ tự động điều chỉnh mức dừng lỗ và lợi nhuận theo biến động thị trường trong thời gian thực, để tối ưu hóa động lực quản lý rủi ro.

Lợi thế chiến lược

  1. Hệ thống xác thực tín hiệu đa chiều giúp tăng độ tin cậy giao dịch
  2. Động thái dừng lỗ lợi nhuận chương trình thích ứng với môi trường thị trường khác nhau
  3. Kết hợp cả hai cách suy nghĩ về xu hướng và đảo ngược để tăng cơ hội giao dịch
  4. Hệ thống quản lý rủi ro tự động hóa làm giảm sai lầm của con người
  5. Tỷ lệ chiến thắng 53.99% và hệ số lợi nhuận 1.44 cho thấy chiến lược ổn định
  6. Chiến lược hỗ trợ nhắc nhở giao dịch trực tiếp, thuận tiện cho các nhà giao dịch

Rủi ro chiến lược

  1. Nhiều chỉ số có thể gây ra sự chậm trễ tín hiệu và mất cơ hội trong thị trường nhanh
  2. Tỷ lệ rút tiền tối đa 56.33% đòi hỏi khả năng chịu rủi ro cao hơn
  3. Giao dịch thường xuyên có thể dẫn đến chi phí giao dịch cao hơn
  4. Chiến lược có thể gặp rủi ro lớn hơn trong thị trường biến động mạnh

Đề xuất kiểm soát rủi ro:

  • Thực hiện kế hoạch quản lý tài chính nghiêm ngặt
  • Kiểm tra và điều chỉnh các tham số thường xuyên
  • Ngừng giao dịch trong thời gian công bố dữ liệu quan trọng
  • Thiết lập giới hạn tổn thất tối đa mỗi ngày

Hướng tối ưu hóa chiến lược

  1. Tối ưu hóa tham số:

    • Các tham số chỉ số để xem xét sử dụng chu kỳ thích ứng
    • Tối ưu hóa thiết lập ATR để tăng tỷ lệ lợi nhuận rủi ro
  2. Hệ thống tín hiệu được cải thiện:

    • Thêm xác nhận chỉ số giao dịch
    • Tham gia chỉ số cảm xúc thị trường
  3. Tối ưu hóa quản lý rủi ro:

    • Thực hiện quản lý vị trí năng động
    • Thêm bộ lọc thời gian
  4. Những cải tiến kỹ thuật:

    • Thêm bộ lọc biến động thị trường
    • Tối ưu hóa thời gian ra sân

Tóm tắt

Chiến lược này đạt được hiệu quả giao dịch tốt hơn thông qua sự kết hợp của nhiều chỉ số kỹ thuật và hệ thống quản lý rủi ro động. Mặc dù có một số rủi ro rút lui, nhưng thông qua kiểm soát rủi ro nghiêm ngặt và tối ưu hóa liên tục, chiến lược thể hiện khả năng thích ứng và ổn định thị trường tốt.

Mã nguồn chiến lược
/*backtest
start: 2024-11-21 00:00:00
end: 2024-11-28 00:00:00
period: 15m
basePeriod: 15m
exchanges: [{"eid":"Futures_Binance","currency":"BTC_USDT"}]
*/

//@version=5
strategy("XAUUSD STRATEGY 10MIN", overlay=true)

// Spread Adjustment (38-point spread)
spread = 38 * syminfo.mintick       

// MACD Calculation
[macdLine, signalLine, _] = ta.macd(close, 12, 26, 9)
macdBuy = ta.crossover(macdLine, signalLine)
macdSell = ta.crossunder(macdLine, signalLine)

// RSI Calculation
rsi = ta.rsi(close, 14)
rsiOverbought = rsi > 65
rsiOversold = rsi < 35

// Bollinger Bands Calculation
basis = ta.sma(close, 20)
dev = 2 * ta.stdev(close, 20)
upperBand = basis + dev
lowerBand = basis - dev

// ATR Calculation for Volatility-Based Stop Loss and Take Profit
atr = ta.atr(14)
stopLoss = 3 * atr
takeProfit = 5 * atr

// Variables to track entry price and line
var line entryLine = na
var int tradeNumber = 0
var string tradeType = ""
var string tradeSignalComment = ""

// Buy Condition
buyCondition = (macdBuy or rsiOversold or close < lowerBand)

// Sell Condition
sellCondition = (macdSell or rsiOverbought or close > upperBand)

// Strategy Entry and Alerts
if (buyCondition and strategy.opentrades == 0)  // Open a new buy trade
    // Remove the previous entry line if it exists
    // if not na(entryLine)
    //     line.delete(entryLine)
    
    // Adjust the entry price by adding the spread (ask price)
    buyPrice = close + spread

    // Enter a new buy trade at the ask price, and close it with the bid price
    strategy.entry("Buy", strategy.long, stop=buyPrice - stopLoss, limit=buyPrice + takeProfit, comment="Enter buy $" + str.tostring(buyPrice))
    tradeNumber := tradeNumber + 1  // Increment trade number
    tradeType := "Entry Long"
    tradeSignalComment := "Enter buy trade"
    
    // Plot new dotted entry line for the current trade
    // entryLine := line.new(bar_index, buyPrice, bar_index + 50, buyPrice, width=1, color=color.green, style=line.style_dotted)
    
    // Send alert for the buy entry
    alert("Trade No: " + str.tostring(tradeNumber) + "\n" +
          "Signal: " + tradeType + " - " + tradeSignalComment + "\n" +
          "Date/Time: " + str.format("{0,date,dd-MM-yyyy HH:mm}", time) + "\n" +
          "Price: " + str.tostring(buyPrice), alert.freq_once_per_bar_close)

if (sellCondition and strategy.opentrades == 0)  // Open a new sell trade
    // Remove the previous entry line if it exists
    // if not na(entryLine)
    //     line.delete(entryLine)
    
    // Adjust the entry price by subtracting the spread (bid price)
    sellPrice = close - spread

    // Enter a new sell trade at the bid price, and close it with the ask price
    strategy.entry("Sell", strategy.short, stop=sellPrice + stopLoss, limit=sellPrice - takeProfit, comment="Enter sell $" + str.tostring(sellPrice))
    tradeNumber := tradeNumber + 1  // Increment trade number
    tradeType := "Entry Short"
    tradeSignalComment := "Enter sell trade"
    
    // Plot new dotted entry line for the current trade
    // entryLine := line.new(bar_index, sellPrice, bar_index + 50, sellPrice, width=1, color=color.red, style=line.style_dotted)
    
    // Send alert for the sell entry
    alert("Trade No: " + str.tostring(tradeNumber) + "\n" +
          "Signal: " + tradeType + " - " + tradeSignalComment + "\n" +
          "Date/Time: " + str.format("{0,date,dd-MM-yyyy HH:mm}", time) + "\n" +
          "Price: " + str.tostring(sellPrice), alert.freq_once_per_bar_close)

// Exit conditions and alerts
if (strategy.position_size > 0 and sellCondition)  // Close buy when sell conditions met
    // Adjust the exit price by subtracting the spread (bid price)
    exitPrice = close - spread
    strategy.close("Buy", comment="Exit buy $" + str.tostring(exitPrice))
    
    // Remove the entry line when the trade is closed
    // if not na(entryLine)
    //     line.delete(entryLine)
    
    // Send alert for the buy exit
    tradeType := "Exit Long"
    tradeSignalComment := "Exit buy trade"
    alert("Trade No: " + str.tostring(tradeNumber) + "\n" +
          "Signal: " + tradeType + " - "  + tradeSignalComment + "\n" +
          "Date/Time: " + str.format("{0,date,dd-MM-yyyy HH:mm}", time) + "\n" +
          "Price: " + str.tostring(exitPrice), alert.freq_once_per_bar_close)

if (strategy.position_size < 0 and buyCondition)  // Close sell when buy conditions met
    // Adjust the exit price by adding the spread (ask price)
    exitPrice = close + spread
    strategy.close("Sell", comment="Exit sell $" + str.tostring(exitPrice))
    
    // Remove the entry line when the trade is closed
    // if not na(entryLine)
    //     line.delete(entryLine)
    
    // Send alert for the sell exit
    tradeType := "Exit Short"
    tradeSignalComment := "Exit sell trade"
    alert("Trade No: " + str.tostring(tradeNumber) + "\n" +
          "Signal: " + tradeType + " - " + tradeSignalComment + "\n" +
          "Date/Time: " + str.format("{0,date,dd-MM-yyyy HH:mm}", time) + "\n" +
          "Price: " + str.tostring(exitPrice), alert.freq_once_per_bar_close)

// Plot Indicators
plot(upperBand, title="Upper Bollinger Band", color=color.blue)
plot(lowerBand, title="Lower Bollinger Band", color=color.blue)