Chiến lược theo dõi xu hướng thông minh dựa trên lý thuyết SMC đa vùng

Tổng quan
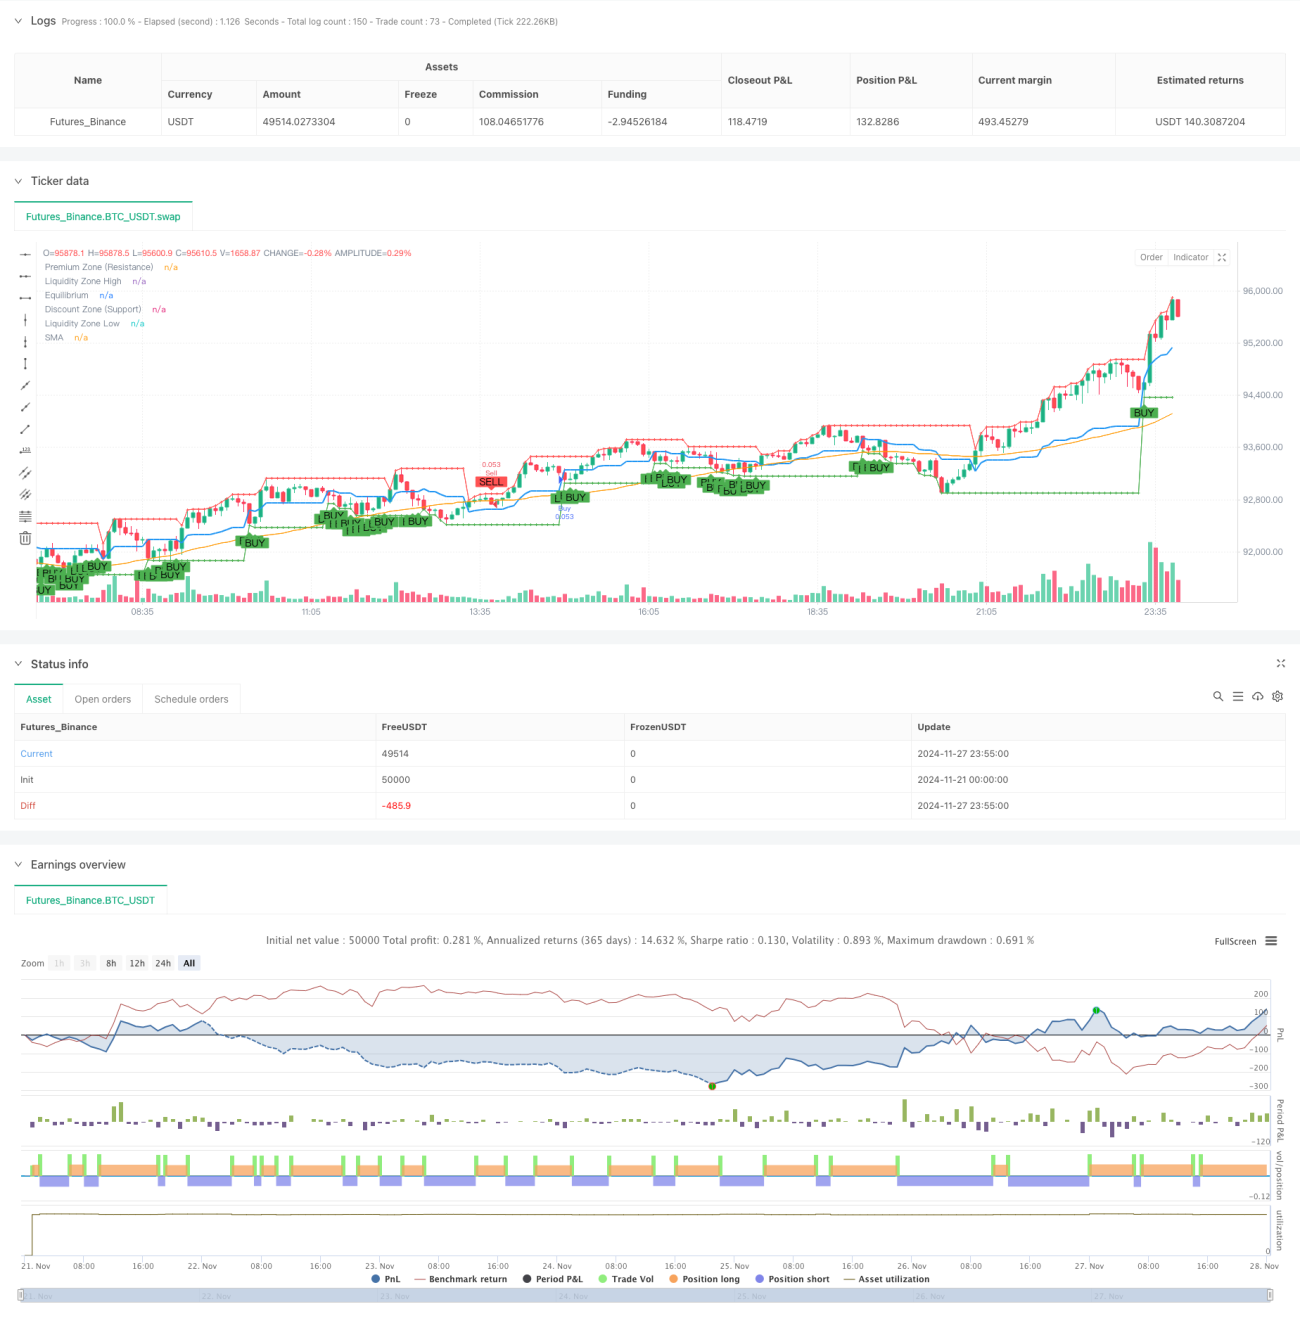
Chiến lược này dựa trên khái niệm SMC của tiền thông minh, xây dựng một hệ thống giao dịch theo dõi xu hướng hoàn chỉnh bằng cách phân chia ba khu vực giá quan trọng bằng cách phân chia vùng cân bằng, vùng giá cao và khu vực giá giảm, kết hợp với phân tích SMA 50 chu kỳ và khối đơn đặt hàng. Chiến lược này nắm bắt cơ hội giao dịch trong biến động giá giữa các khu vực khác nhau bằng cách xác định các điểm hỗ trợ và kháng cự quan trọng trong cấu trúc thị trường.
Nguyên tắc chiến lược
Logic cốt lõi của chiến lược bao gồm các yếu tố chính sau:
- Xác định phạm vi biến động của thị trường bằng cách tính toán các điểm cao và thấp của 8 đường K gần nhất.
- Với giá trị trung bình của các điểm cao thấp biến động như vùng cân bằng, vùng cao hơn cân bằng được định nghĩa là vùng giá trị cao hơn, vùng thấp hơn cân bằng được định nghĩa là vùng giá trị giảm.
- Sử dụng SMA 50 chu kỳ để xác định hướng xu hướng tổng thể, giá được coi là xu hướng đa đầu trên SMA, ngược lại là xu hướng không đầu.
- Tín hiệu mua được tạo ra khi giá đứng trên SMA trong vùng giảm giá, và tín hiệu bán được tạo ra khi giá giảm xuống SMA trong vùng tăng giá.
- Các khối lệnh được xác định bằng cách phân tích giá cao nhất và giá thấp nhất trong 20 đường K để xác nhận tín hiệu giao dịch.
- Đánh dấu các điểm biến động cao và thấp như là khu vực lưu động, dự đoán các điểm đảo ngược giá có thể xảy ra.
Lợi thế chiến lược
- Phương pháp phân chia khu vực có cấu trúc, có thể xác định rõ ràng giai đoạn thị trường.
- Cơ chế xác nhận tín hiệu đa dạng, tăng độ chính xác giao dịch thông qua xác minh ba lần khu vực, xu hướng và khối đơn đặt hàng.
- Động lực thích ứng với sự thay đổi của thị trường, cập nhật mức giá quan trọng trong thời gian thực.
- Hệ thống quản lý rủi ro hoàn chỉnh, bao gồm quản lý lỗ hổng và vị trí.
- Mã có hiệu quả, đơn giản, dễ bảo trì và tối ưu hóa.
Rủi ro chiến lược
- Các tín hiệu phá vỡ giả có thể xuất hiện trong thị trường biến động mạnh.
- Các chỉ số dựa trên tính toán dữ liệu lịch sử có thể bị tụt hậu trong thị trường chuyển đổi nhanh chóng.
- Đường trung bình di chuyển có chu kỳ cố định có thể không áp dụng cho tất cả các môi trường thị trường.
- Cần thiết lập mức dừng lỗ hợp lý để kiểm soát rủi ro.
Các biện pháp sau đây được khuyến nghị để quản lý rủi ro:
- Động thái điều chỉnh tham số để phù hợp với môi trường thị trường khác nhau
- Tăng bộ lọc tỷ lệ dao động
- Thực hiện các quy tắc quản lý tài chính nghiêm ngặt
- Thường xuyên đánh giá và tối ưu hóa các tham số chiến lược
Hướng tối ưu hóa chiến lược
- Ghi các tham số thích ứng:
- Phạm vi khu vực được điều chỉnh theo biến động thị trường
- Trung bình di chuyển sử dụng chu kỳ thích ứng
- Hình ảnh:
- Thêm cơ chế xác nhận khối lượng
- Tham gia đánh giá hỗ trợ chỉ số động lực
- Cải thiện quản lý rủi ro:
- Thực hiện cơ chế dừng lỗ động
- Tối ưu hóa các thuật toán quản lý vị thế
- Tăng hiệu quả thực thi:
- Tối ưu hóa logic tính toán giảm tiêu thụ tài nguyên
- Cải thiện cơ chế tạo tín hiệu để tăng tốc độ phản ứng
Tóm tắt
Chiến lược này xây dựng một hệ thống theo dõi xu hướng vững chắc thông qua phân vùng thông minh và cơ chế xác nhận tín hiệu đa dạng. Điểm mạnh cốt lõi của chiến lược là phương pháp phân tích cấu trúc thị trường rõ ràng và hệ thống quản lý rủi ro hoàn hảo. Bằng cách tối ưu hóa và cải tiến liên tục, chiến lược dự kiến sẽ duy trì hiệu suất ổn định trong các môi trường thị trường khác nhau.
/*backtest
start: 2024-11-21 00:00:00
end: 2024-11-28 00:00:00
period: 5m
basePeriod: 5m
exchanges: [{"eid":"Futures_Binance","currency":"BTC_USDT"}]
*/

//@version=5
//@version=5
strategy("SMC Strategy with Premium, Equilibrium, and Discount Zones", overlay=true, default_qty_type=strategy.percent_of_equity, default_qty_value=10)
- 1