Chiến lược giao dịch định lượng đột phá xu hướng nhiều chỉ báo

Tổng quan
Đây là một chiến lược giao dịch định lượng đa chỉ số kết hợp các đường Brin, biểu đồ cân bằng đầu tiên và các mức kháng cự hỗ trợ. Chiến lược này xác định các cơ hội giao dịch tiềm năng bằng cách phân tích biến động của thị trường, cường độ của xu hướng và mức giá quan trọng. Chiến lược này sử dụng các điều kiện nhập cảnh chính xác và phương pháp quản lý rủi ro để đạt được hiệu suất giao dịch ổn định.
Nguyên tắc chiến lược
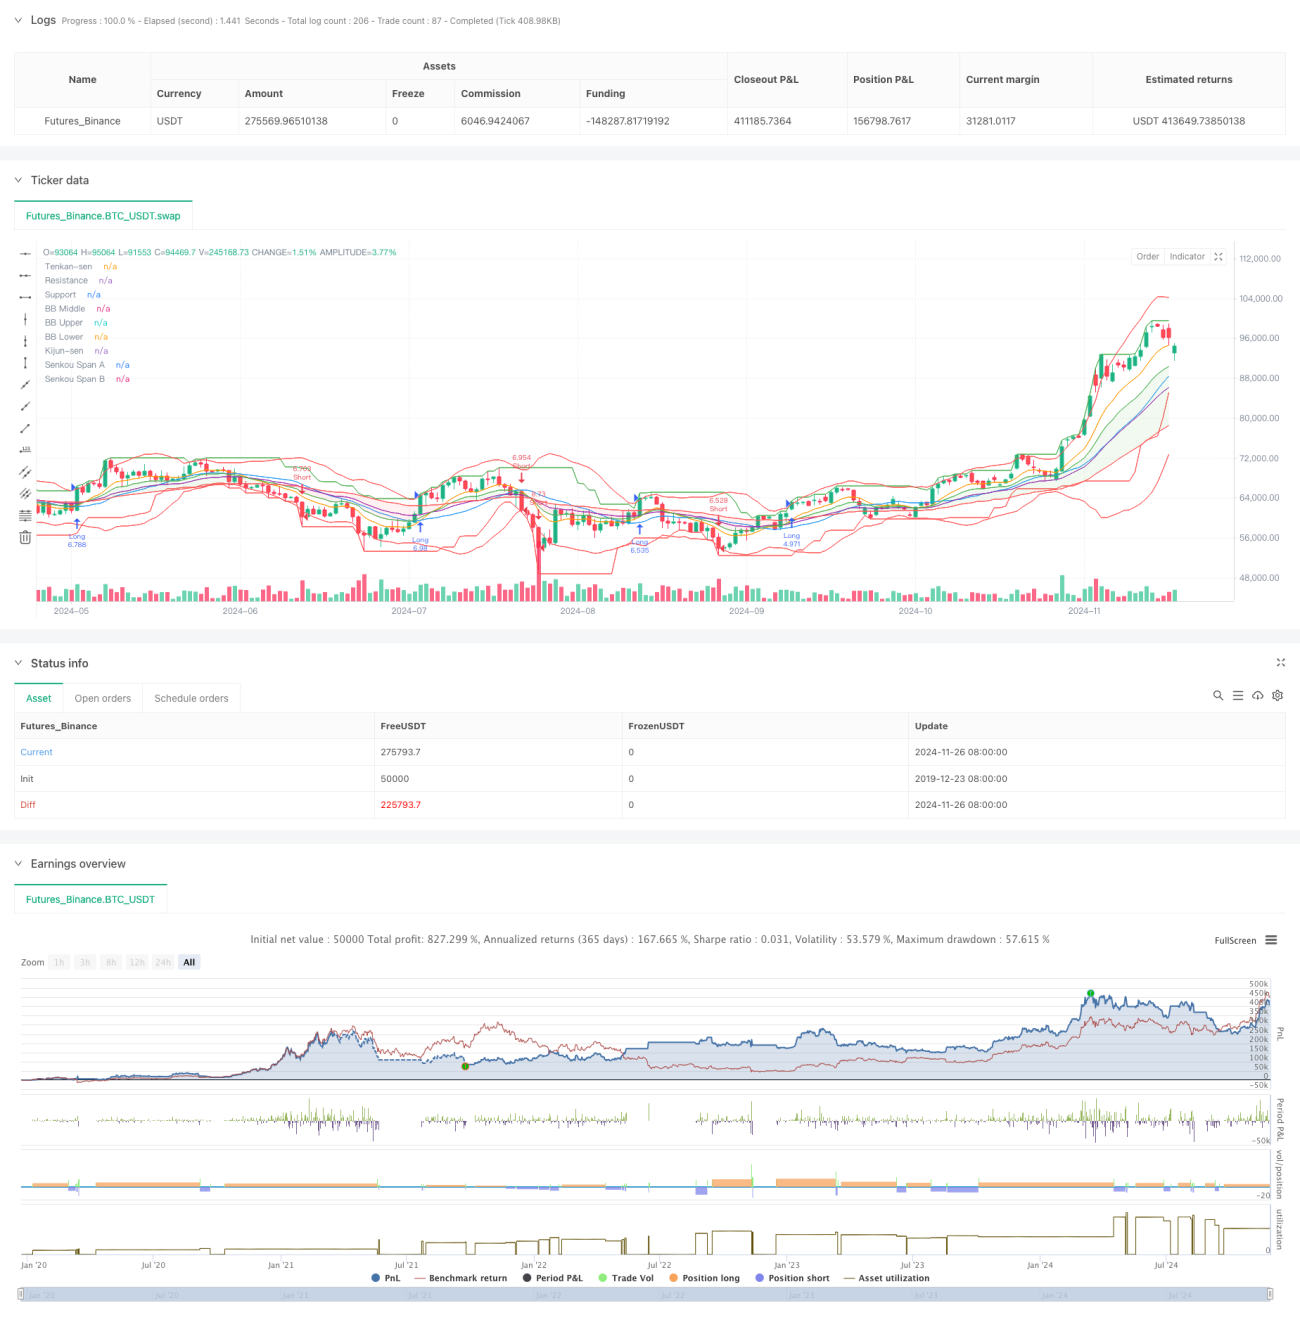
Chiến lược này sử dụng ba thành phần chỉ số kỹ thuật chính: Brinband để đo lường sự biến động của thị trường và tình trạng quá mua quá bán; Đồ thị cân bằng bằng mắt để đánh giá hướng và cường độ của xu hướng; Mức kháng cự hỗ trợ để xác định mức giá quan trọng. Việc sử dụng kết hợp nhiều chỉ số cung cấp tầm nhìn toàn diện hơn về thị trường.
Các tín hiệu giao dịch được tạo ra dựa trên các điều kiện sau: khi giá phá vỡ đường dây Bollinger và vượt qua đỉnh cao trước đó, kích hoạt nhiều tín hiệu; khi giá phá vỡ đường dây Bollinger và nằm dưới đỉnh cao trước đó, kích hoạt tín hiệu lỗ. Chiến lược cũng bao gồm thiết lập dừng lỗ dựa trên tỷ lệ phần trăm để kiểm soát rủi ro.
Lợi thế chiến lược
- Xác minh chéo đa chỉ số nâng cao độ tin cậy của tín hiệu giao dịch
- Kết hợp lợi thế của việc theo dõi xu hướng và phá vỡ giao dịch
- Có cơ chế quản lý rủi ro rõ ràng
- Các tham số có thể được điều chỉnh linh hoạt theo các điều kiện thị trường khác nhau
- Giảm tác động của tín hiệu giả thông qua các chỉ số kỹ thuật
- Hỗ trợ hình ảnh đầy đủ cho các quyết định giao dịch
Rủi ro chiến lược
- Tín hiệu đột phá sai thường xuyên có thể xảy ra trong một thị trường biến động
- Nhiều chỉ báo có thể gây ra độ trễ tín hiệu
- Tối ưu hóa tham số có thể dẫn đến quá khớp
- Các lệnh dừng có thể không hiệu quả khi thị trường biến động mạnh
- Chi phí giao dịch có thể ảnh hưởng đến lợi nhuận chiến lược
Các biện pháp quản lý rủi ro được đề xuất như điều chỉnh vị trí dừng lỗ, tối ưu hóa thiết lập tham số, tăng điều kiện lọc.
Hướng tối ưu hóa chiến lược
- Tăng số lượng phân tích giao dịch, tăng độ tin cậy tín hiệu
- Giới thiệu cơ chế điều chỉnh tham số thích ứng
- Thêm bộ lọc biến động thị trường
- Tối ưu hóa các cơ chế dừng lỗ, chẳng hạn như giới thiệu dừng lỗ di động
- Thêm tính năng lọc thời gian để tránh giao dịch theo thời gian
- Thêm hệ thống kiểm soát rút lui
Tóm tắt
Đây là một chiến lược giao dịch định lượng sử dụng nhiều chỉ số kỹ thuật tổng hợp để nắm bắt cơ hội giao dịch thông qua phá vỡ xu hướng và xác nhận tín hiệu đa. Ưu điểm của chiến lược là tín hiệu có độ tin cậy cao, quản lý rủi ro hoàn hảo, nhưng cần chú ý đến các vấn đề như phá vỡ giả và tối ưu hóa tham số.
/*backtest
start: 2019-12-23 08:00:00
end: 2024-11-27 08:00:00
period: 1d
basePeriod: 1d
exchanges: [{"eid":"Futures_Binance","currency":"BTC_USDT"}]
*/

//@version=5
strategy("BB Ichimoku S/R Strategy", overlay=true, initial_capital=10000, default_qty_type=strategy.percent_of_equity, default_qty_value=100)

// Input parameters- 1