
Tổng quan
Chiến lược này là một hệ thống theo dõi xu hướng khu vực động dựa trên hai đường trung bình (EMA nhanh và EMA chậm). Nó phân chia các khu vực giao dịch khác nhau bằng cách xác định mối quan hệ vị trí giữa giá và đường trung bình.
Nguyên tắc chiến lược
Trọng tâm của chiến lược là phân chia tình trạng thị trường thành sáu khu vực khác nhau thông qua mối quan hệ chéo giữa EMA nhanh (thường là 12 chu kỳ) và EMA chậm (thường là 26 chu kỳ), kết hợp với vị trí giá. Khi đường nhanh nằm trên đường chậm, thị trường được coi là đang trong xu hướng đa đầu; ngược lại, nó được coi là xu hướng không đầu.
Lợi thế chiến lược
- Tính trực quan thị giác: Các nhà giao dịch có thể trực quan đánh giá tình trạng thị trường và cơ hội giao dịch tiềm năng thông qua sự thay đổi động của vùng màu.
- Xác nhận xu hướng: Hệ thống hai dòng đồng nhất cung cấp cơ chế xác nhận xu hướng đáng tin cậy, giảm tín hiệu sai.
- Quản lý rủi ro: Phân vùng rõ ràng giúp xây dựng chiến lược ngăn chặn lỗ.
- Khả năng thích ứng: Chiến lược có thể được áp dụng trong các chu kỳ thời gian khác nhau, phù hợp với mọi môi trường thị trường.
- Các tham số có thể điều chỉnh: chu kỳ trung bình và tham số trượt có thể được tối ưu hóa theo các đặc điểm thị trường khác nhau.
Rủi ro chiến lược
- Sự chậm trễ: Chỉ số đường trung bình có tính chất chậm trễ, có thể gây ra sự chậm trễ trong thời gian nhập cảnh hoặc xuất cảnh.
- Không áp dụng cho thị trường chấn động: có thể tạo ra các tín hiệu giả thường xuyên trong thị trường chấn động ngang.
- Rủi ro đảo ngược xu hướng: Phản ứng của chiến lược có thể không đủ nhanh khi xu hướng đột ngột đảo ngược.
- Tùy thuộc tham số: Các tham số tối ưu có thể có sự khác biệt đáng kể trong các môi trường thị trường khác nhau.
Hướng tối ưu hóa chiến lược
- Tiếp theo, bạn có thể sử dụng một bộ lọc biến động để điều chỉnh các điều kiện giao dịch trong môi trường biến động cao và tránh các tín hiệu giả.
- Tăng xác nhận khối lượng giao dịch: kết hợp các chỉ số khối lượng giao dịch để tăng độ tin cậy tín hiệu.
- Điều chỉnh tham số động: Tự động điều chỉnh chu kỳ đường trung bình theo tình trạng thị trường.
- Thêm chỉ số cường độ xu hướng: giới thiệu các chỉ số đánh giá cường độ xu hướng như ADX.
- Tối ưu hóa chiến lược dừng lỗ: Thiết kế chương trình dừng lỗ động dựa trên ATR.
Tóm tắt
Đây là một chiến lược theo dõi xu hướng kết hợp giữa hệ thống hai đường cong truyền thống và khái niệm phân vùng hiện đại. Nó cung cấp cho các nhà giao dịch một khuôn khổ giao dịch đáng tin cậy thông qua phản hồi trực quan trực quan và các quy tắc giao dịch rõ ràng. Mặc dù có các vấn đề về sự chậm trễ vốn có của hệ thống đường cong, chiến lược này có thể đạt được hiệu suất ổn định trong thị trường xu hướng thông qua tối ưu hóa tham số và quản lý rủi ro hợp lý.
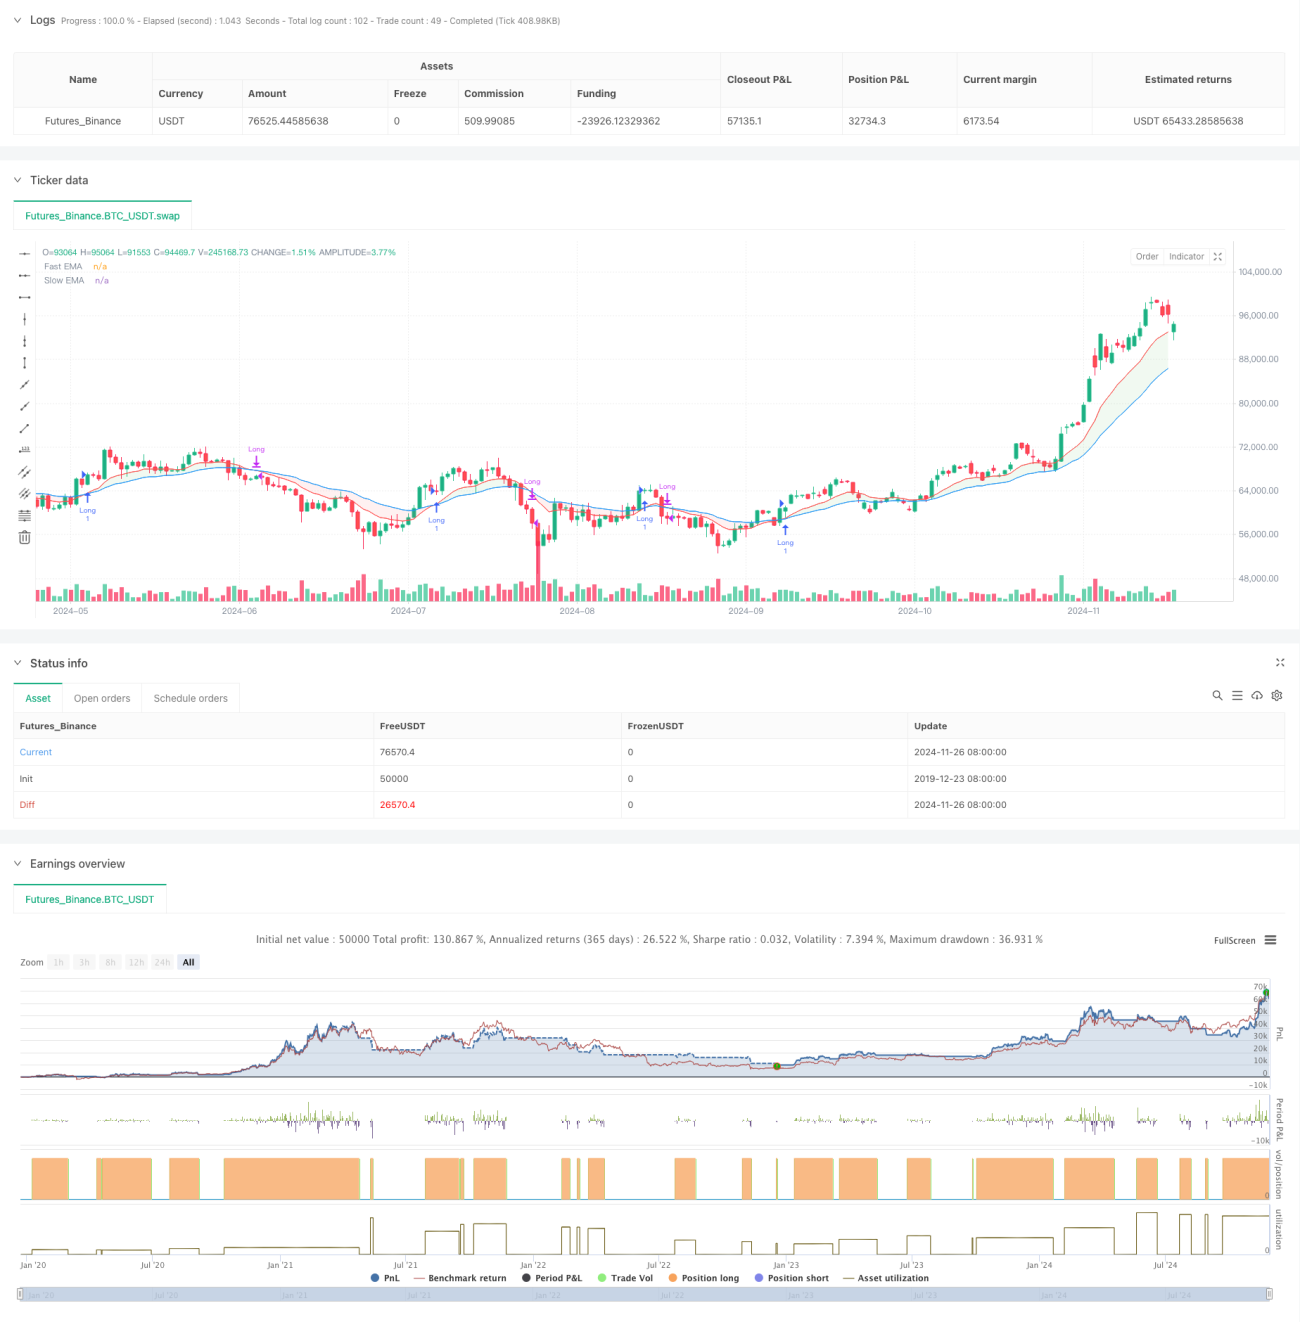
/*backtest
start: 2019-12-23 08:00:00
end: 2024-11-27 08:00:00
period: 1d
basePeriod: 1d
exchanges: [{"eid":"Futures_Binance","currency":"BTC_USDT"}]
*/

//@version=5
strategy("NUTJP CDC ActionZone 2024", overlay=true, precision=6, commission_value=0.1, slippage=3)

//****************************************************************************//- 1