
Tổng quan
Chiến lược này là một hệ thống giao dịch định lượng dựa trên tín hiệu bán tháo RSI và điểm dừng ATR động. Chiến lược sử dụng dữ liệu cấp độ ngày, kết hợp với tín hiệu bán tháo của chỉ số RSI và lọc xu hướng của đường trung bình 200 ngày, để nắm bắt cơ hội bật lên khi thị trường bán tháo. Chiến lược này sử dụng cơ chế bảo vệ kép cho điểm dừng ATR động và điểm dừng phần trăm tĩnh, và đặt mục tiêu lợi nhuận ba lần để tối đa hóa lợi nhuận bằng cách giảm vị trí theo giai đoạn.
Nguyên tắc chiến lược
Logic cốt lõi của chiến lược bao gồm các yếu tố chính sau:
- Tín hiệu đầu vào: Hệ thống phát ra nhiều tín hiệu khi RSI ((5)) thấp hơn mức bán tháo 30 và giá nằm trên đường trung bình 200 ngày.
- Cơ chế dừng lỗ: Cơ chế kép kết hợp dừng động 1,5 lần ATR ((20) và dừng cố định 25%.
- Mục tiêu lợi nhuận: đặt ba mục tiêu là 5%, 10% và 15%, giảm 33% và 66% khi đạt được mục tiêu.
- Quản lý vị trí: Chúng tôi khuyên bạn nên sử dụng 59.13% vị trí được tính toán theo quy tắc Kelly hoặc giữ nguyên 75% vị trí để giao dịch.
Lợi thế chiến lược
- Xác nhận xu hướng kép: Xác nhận xu hướng vượt mức RSI và xu hướng đường trung bình để tăng tỷ lệ chiến thắng giao dịch.
- Kiểm soát rủi ro linh hoạt: Động ATR dừng có thể điều chỉnh theo biến động của thị trường, dừng cố định cung cấp đường phòng thủ cuối cùng.
- Quản lý lợi nhuận thông minh: Bảng mục tiêu ba lần kết hợp với việc giảm bớt cổ phiếu theo giai đoạn, có thể khóa một phần lợi nhuận mà không bỏ lỡ thị trường lớn.
- Khoa học quản lý tiền: Sử dụng quy tắc Kelly để tối ưu hóa vị trí, cân bằng giữa rủi ro và lợi nhuận.
Rủi ro chiến lược
-
Xu hướng phụ thuộc: Chiến lược có thể thường xuyên gây ra lỗ dừng trong thị trường biến động.
Lưu ý: Bạn có thể thêm bộ lọc cho các tín hiệu giả trong chỉ số rung động. -
Giảm lỗ lớn: Giảm lỗ cố định 25% có thể dẫn đến tổn thất quá lớn.
Khuyến nghị: Điều chỉnh tỷ lệ dừng lỗ theo khả năng chịu rủi ro của cá nhân. -
Rủi ro rút lui: Lợi nhuận phân đoạn có thể giảm vị thế quá sớm trong tình hình tăng trưởng mạnh.
Đề xuất: Bạn có thể thay đổi mục tiêu lợi nhuận hoặc giữ một số vị trí theo xu hướng.
Hướng tối ưu hóa chiến lược
- Tối ưu hóa tín hiệu:
- Thêm xác nhận số lượng giao dịch
- Kết hợp các chỉ số xu hướng như MACD
- Giới thiệu bộ lọc biến động
- Tối ưu hóa Stop Loss:
- Đạt được tỷ lệ dừng động
- Tăng thời gian dừng
- Thêm bộ lọc so với lợi nhuận
- Tăng lợi nhuận:
- Định vị trí mục tiêu động dựa trên ATR
- Thực hiện Tracking Stop
- Tối ưu hóa tỷ lệ giảm
Tóm tắt
Chiến lược này xây dựng một hệ thống giao dịch hoàn chỉnh bằng cách kết hợp các tín hiệu bán tháo RSI và lọc xu hướng đồng nhất, kết hợp với ATR dừng động và mục tiêu lợi nhuận ba lần. Ưu điểm của chiến lược là khả năng kiểm soát rủi ro linh hoạt, quản lý lợi nhuận hợp lý, nhưng vẫn cần điều chỉnh tối ưu hóa theo tình hình thị trường thực tế và sở thích rủi ro cá nhân.
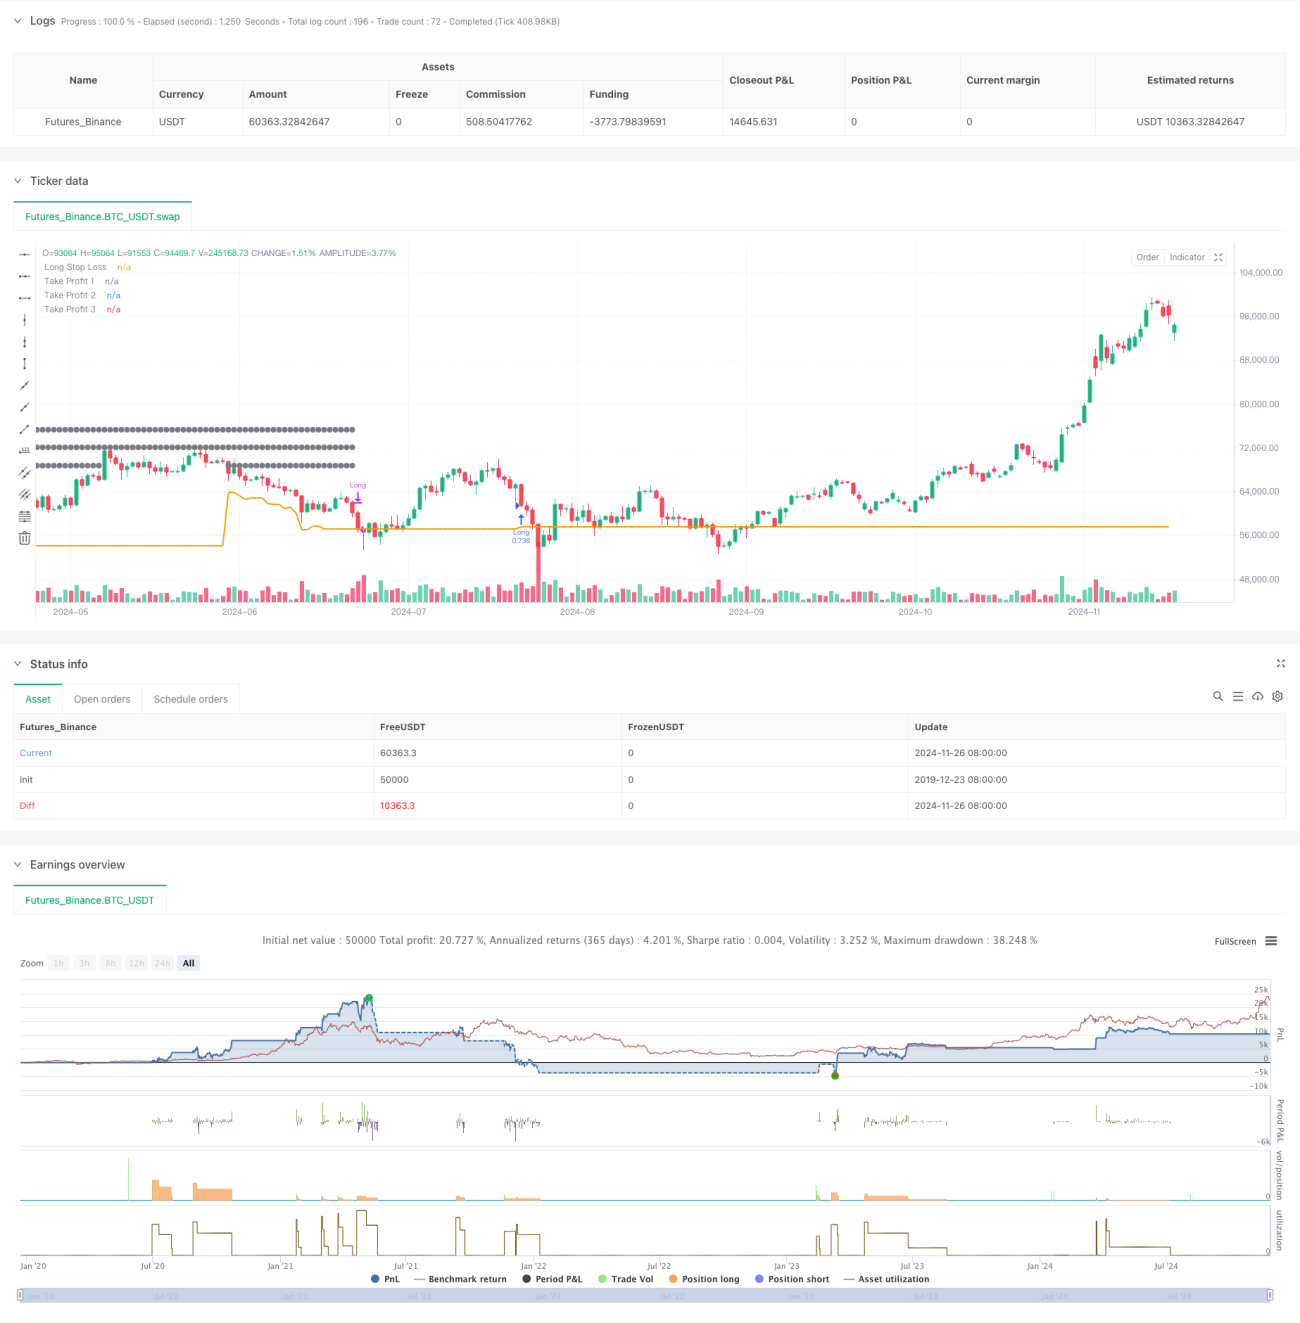
/*backtest
start: 2019-12-23 08:00:00
end: 2024-11-27 08:00:00
period: 1d
basePeriod: 1d
exchanges: [{"eid":"Futures_Binance","currency":"BTC_USDT"}]
*/

// This work is licensed under a Attribution-NonCommercial-ShareAlike 4.0 International (CC BY-NC-SA/4.0) https://creativecommons.org/licenses/by-nc-sa/4.0/
// © wielkieef

//@version=5- 1