Chiến lược giao dịch phục hồi quá bán RSI động kết hợp với mô hình tối ưu hóa dừng lỗ

Tổng quan
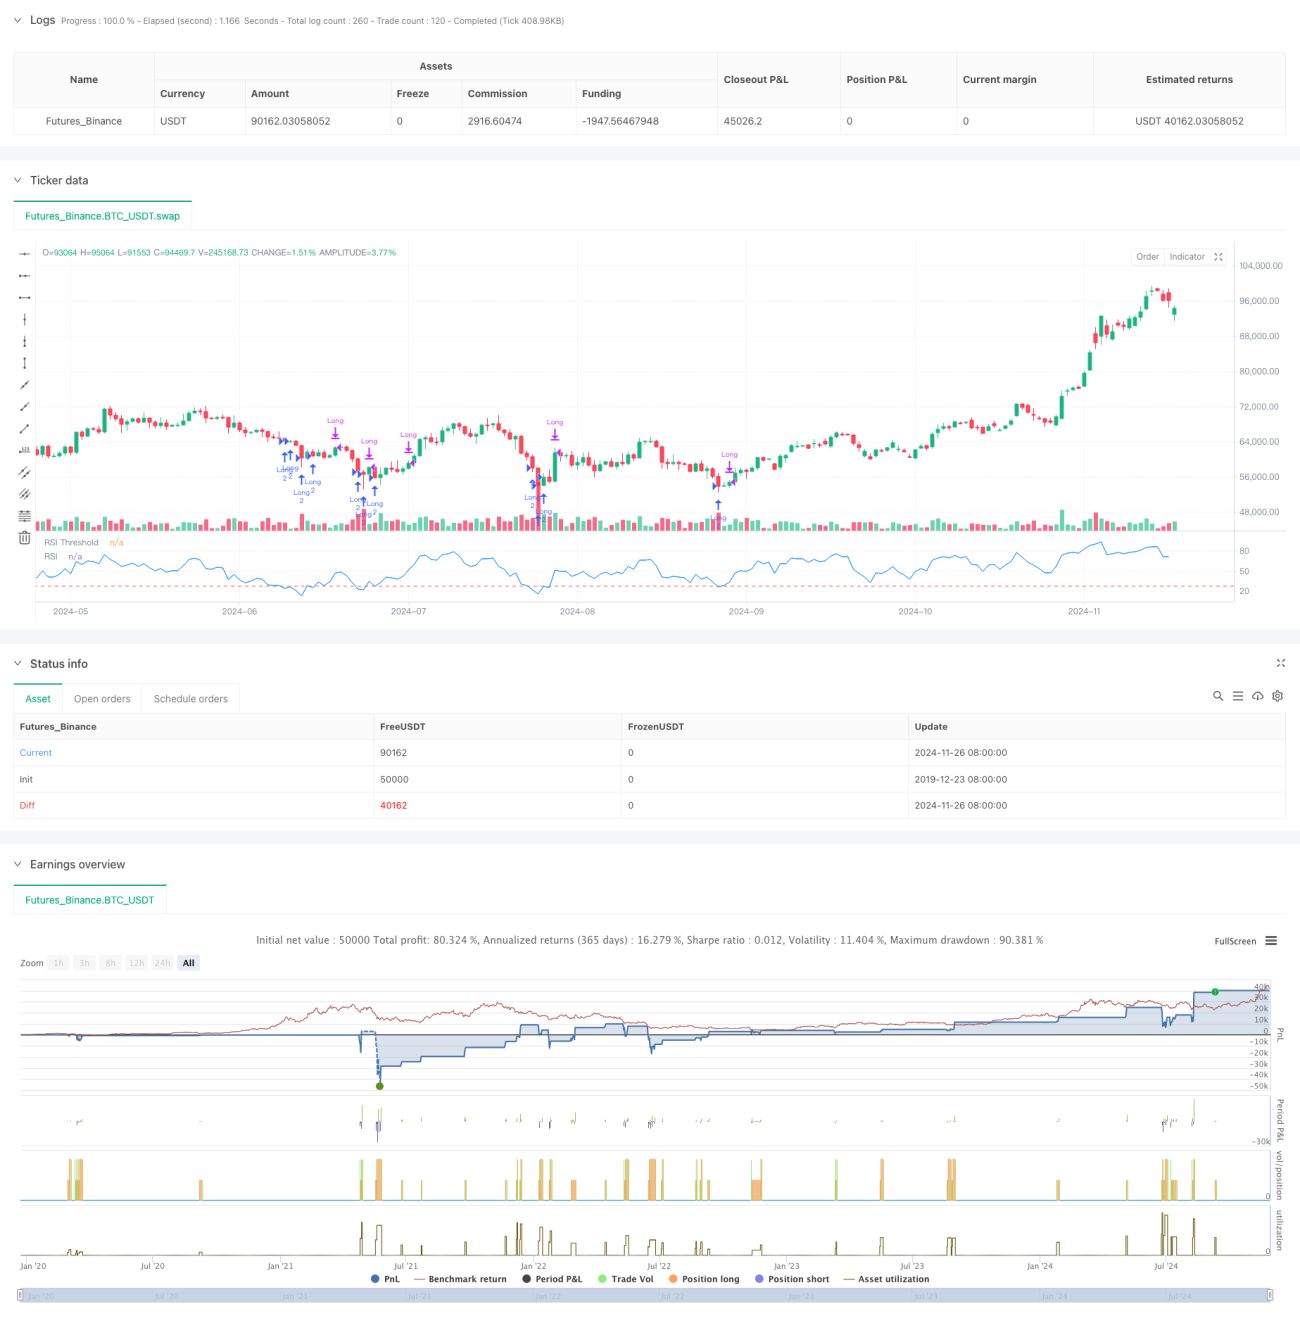
Đây là một chiến lược giao dịch động dựa trên chỉ số tương đối mạnh (RSI) kết hợp với cơ chế dừng lỗ linh hoạt. Chiến lược này chủ yếu nhắm vào các khu vực bán tháo của thị trường, thu lợi nhuận bằng cách nắm bắt cơ hội phục hồi của giá.
Nguyên tắc chiến lược
Chiến lược này hoạt động dựa trên các yếu tố quan trọng sau:
- Chỉ số RSI được tính toán bằng cách sử dụng 8 chu kỳ làm giá trị mặc định, chu kỳ này được thiết lập ngắn hơn, có thể nắm bắt tình trạng quá bán của thị trường nhanh hơn.
- Điều kiện nhập cảnh được đặt ở mức RSI thấp hơn 28, cho thấy thị trường có thể bị bán tháo nghiêm trọng.
- Cơ chế dừng lỗ sử dụng phương thức phần trăm dựa trên giá vào, được đặt mặc định là 5%, cung cấp ranh giới kiểm soát rủi ro rõ ràng.
- Các tín hiệu xuất phát dựa trên mức giá vượt mức cao trước đó, điều này cho phép lợi nhuận tiếp tục kéo dài.
- Chiến lược này sử dụng số lượng giữ cố định và cho phép tăng gấp 2 lần số tiền đặt cược của kim tự tháp.
Lợi thế chiến lược
- Cơ chế kiểm soát rủi ro được hoàn thiện, cung cấp ranh giới rủi ro rõ ràng thông qua phần trăm dừng lỗ.
- Logic nhập cảnh rõ ràng, phán quyết bán tháo RSI có khả năng thích ứng mạnh mẽ với thị trường.
- Các cơ chế thoát sẽ cho phép lợi nhuận phát triển đầy đủ và tránh các giao dịch tiềm năng bị đóng cửa sớm.
- Các tham số chiến lược có thể được điều chỉnh để tối ưu hóa theo các điều kiện thị trường khác nhau.
- Các yếu tố chi phí giao dịch và điểm trượt được tính đến, gần gũi hơn với môi trường giao dịch thực tế.
Rủi ro chiến lược
- Chỉ số RSI có thể có tín hiệu sai, đặc biệt là trong thị trường biến động.
- Lãi suất dừng cố định có thể quá cao trong thị trường có nhiều biến động.
- Phương pháp ra sân vượt qua đỉnh cao trước đó có thể bỏ lỡ cơ hội giành chiến thắng tốt nhất khi biến động mạnh mẽ.
- Cho phép tăng gấp 2 lần kim tự tháp có thể làm tăng rủi ro khi thị trường tiếp tục giảm.
Hướng tối ưu hóa chiến lược
- Có thể xem xét giới thiệu chỉ số biến động để điều chỉnh tỷ lệ dừng lỗ động.
- Thêm bộ lọc xu hướng để tránh tham gia thường xuyên trong xu hướng giảm mạnh.
- Tối ưu hóa cơ chế ra ngoài, có thể kết hợp với khu vực mua quá mức RSI như tài liệu tham khảo ra ngoài phụ trợ.
- Tham gia vào cơ chế xác nhận số lượng giao hàng, tăng độ tin cậy của tín hiệu nhập cảnh.
- Phát triển hệ thống quản lý vị thế động, điều chỉnh số lượng nắm giữ theo tình hình thị trường.
Tóm tắt
Đây là một chiến lược giao dịch được thiết kế tốt, kết hợp các phán quyết bán tháo RSI và cơ chế dừng lỗ, có sự cân bằng tốt giữa kiểm soát rủi ro và nắm bắt cơ hội lợi nhuận. Chiến lược có khả năng điều chỉnh mạnh mẽ, phù hợp để nâng cao hiệu suất thông qua tối ưu hóa tham số trong các môi trường thị trường khác nhau. Mặc dù có một số rủi ro tiềm ẩn, nhưng có thể nâng cao hơn nữa sự ổn định và lợi nhuận của chiến lược thông qua hướng tối ưu hóa được đề xuất.
/*backtest
start: 2019-12-23 08:00:00
end: 2024-11-27 08:00:00
period: 1d
basePeriod: 1d
exchanges: [{"eid":"Futures_Binance","currency":"BTC_USDT"}]
*/

//@version=5
strategy("RSI Strategy with Adjustable RSI and Stop-Loss", overlay=false,
         default_qty_type=strategy.fixed, default_qty_value=2,
initial_capital=10000, pyramiding=2, - 1