Chiến lược suy giảm cực độ của thị trường dựa trên độ lệch thống kê

Tổng quan
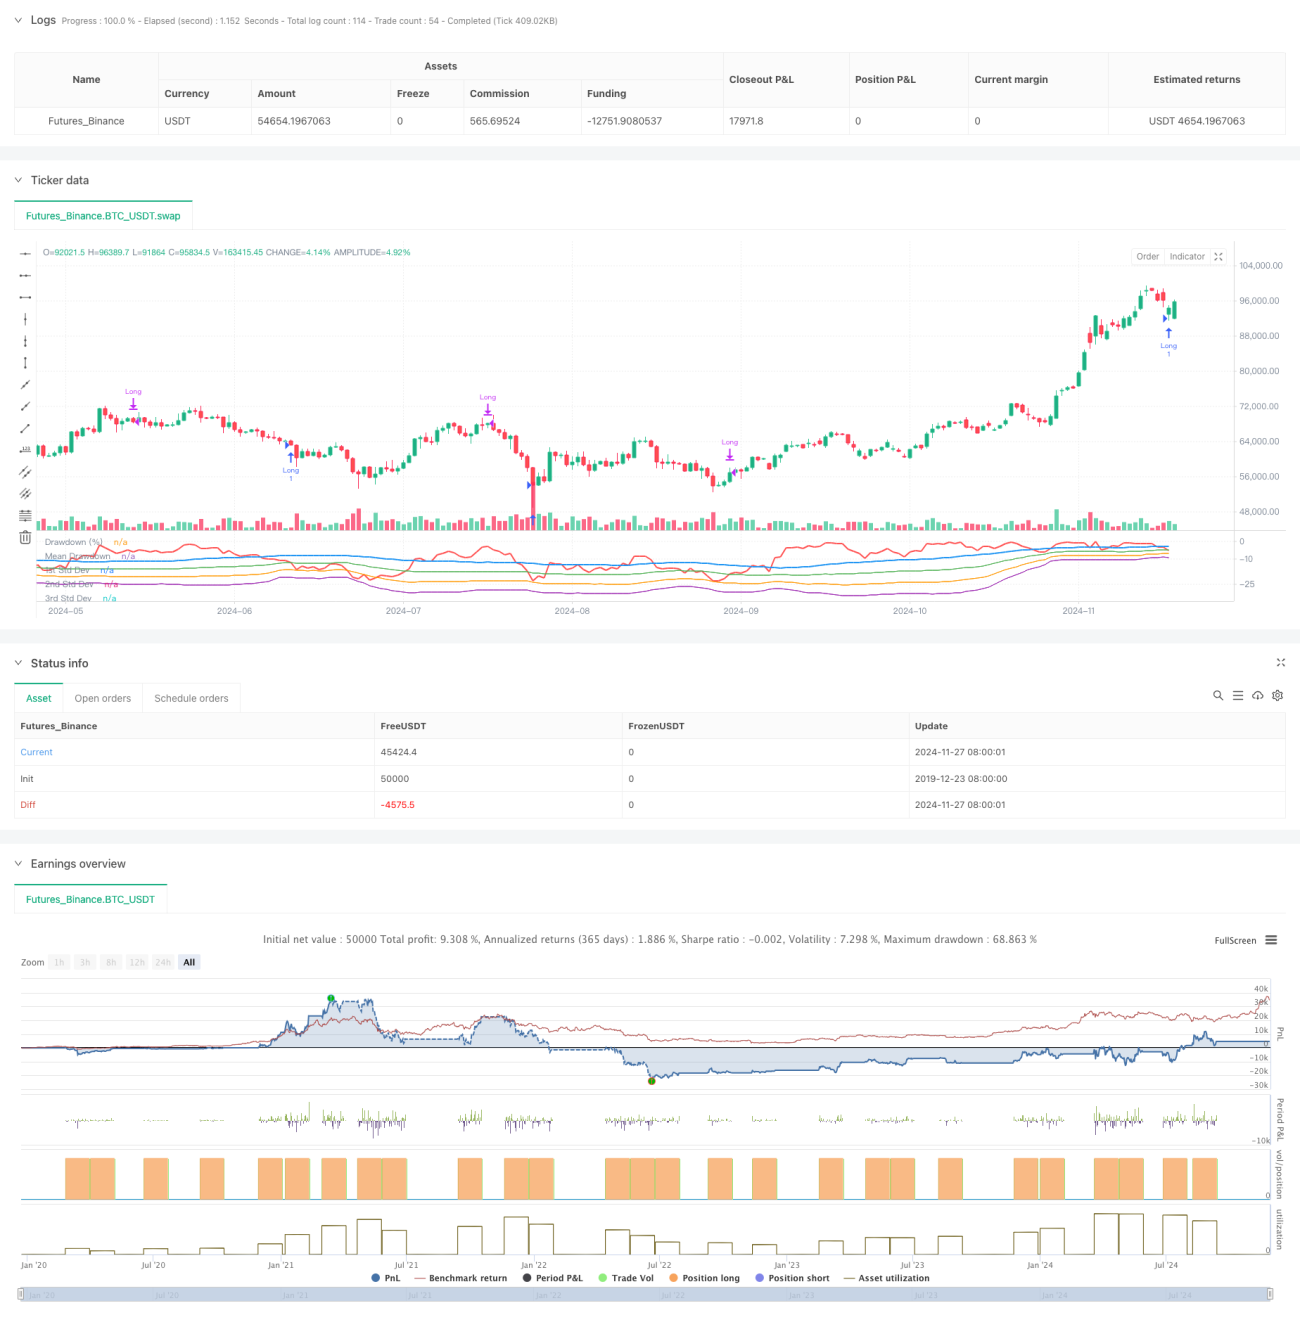
Chiến lược này giao dịch dựa trên các đặc tính thống kê khi thị trường giảm mạnh. Bằng cách phân tích thống kê về sự rút lui, sử dụng chênh lệch tiêu chuẩn để đo mức độ cực đoan của biến động thị trường, mua khi thị trường giảm vượt quá phạm vi bình thường. Ý tưởng cốt lõi của chiến lược là nắm bắt cơ hội giảm mạnh do cảm xúc hoảng loạn của thị trường và xác định cơ hội đầu tư do hành vi phi lý của thị trường thông qua các phương pháp thống kê toán học.
Nguyên tắc chiến lược
Chiến lược sử dụng các tính năng thống kê về mức thu hồi và thu hồi tối đa của giá trong cửa sổ thời gian cuộn. Đầu tiên, tính giá cao nhất trong 50 chu kỳ qua, sau đó tính phần trăm thu hồi so với giá cao nhất hiện tại. Tiếp theo, tính trung bình và chênh lệch chuẩn của thu hồi, đặt chênh lệch chuẩn gấp 1 lần để kích hoạt ngưỡng thấp.
Lợi thế chiến lược
- Chiến lược dựa trên các nguyên tắc thống kê, có nền tảng lý thuyết vững chắc. Bằng cách đo lường mức độ cực đoan của biến động thị trường thông qua chênh lệch tiêu chuẩn, phương pháp là khoa học khách quan.
- Chiến lược này có thể nắm bắt hiệu quả các cơ hội đầu tư trong thời gian thị trường hoảng loạn.
- Việc sử dụng cách thanh lý định kỳ tránh được vấn đề theo dõi lỗ hổng có thể bị bỏ lỡ.
- Các tham số chiến lược có thể được điều chỉnh một cách linh hoạt theo các điều kiện thị trường khác nhau và đặc điểm của các loại giao dịch.
- Tính toán các chỉ số rút và chênh lệch tiêu chuẩn đơn giản, logic chiến lược rõ ràng, dễ hiểu và thực hiện.
Rủi ro chiến lược
- Thị trường có thể có sự sụt giảm liên tục, dẫn đến việc chiến lược thường xuyên tham gia nhưng vẫn thua lỗ.
- Các vị thế yên ổn định có thể bỏ lỡ một khoảng trống lớn hơn để tăng. Các phương pháp yên ổn theo dõi xu hướng có thể được xem xét.
- Tính năng thống kê thu hồi có thể thay đổi theo môi trường thị trường thay đổi. Cần thường xuyên cập nhật các thiết lập tham số.
- Chiến lược không tính đến thông tin thị trường khác như khối lượng giao dịch.
- Trong một môi trường thị trường biến động mạnh, chênh lệch tiêu chuẩn có thể không đúng. Các biện pháp kiểm soát rủi ro được đề xuất.
Hướng tối ưu hóa chiến lược
- Các nhà đầu tư đã đưa ra một số chỉ số giao dịch để xác nhận mức độ lo lắng của thị trường.
- Tăng chỉ số xu hướng, tránh tham gia thường xuyên trong xu hướng giảm.
- Tối ưu hóa cơ chế thanh toán, điều chỉnh thời gian giữ vị trí theo hoạt động của thị trường.
- Tăng thiết lập dừng lỗ, kiểm soát rủi ro giao dịch đơn.
- Xem xét sử dụng các tham số thích ứng để cải thiện khả năng thích ứng của chiến lược với sự thay đổi của thị trường.
Tóm tắt
Chiến lược này có cơ sở lý thuyết và giá trị thực tế tốt. Lập luận chiến lược đơn giản và rõ ràng, tham số có thể điều chỉnh được, phù hợp để mở rộng và tối ưu hóa chiến lược cơ bản. Bằng cách thêm các chỉ số kỹ thuật khác và các biện pháp kiểm soát rủi ro, bạn có thể nâng cao hơn nữa sự ổn định và khả năng lợi nhuận của chiến lược. Trong giao dịch trực tiếp, nên kết hợp các đặc điểm của môi trường thị trường và loại giao dịch, đặt tham số cẩn thận, kiểm soát rủi ro tốt.
- 1