Chiến lược lọc biến động và theo dõi xu hướng đường tín hiệu động

DSL ATR RSI ZLEMA SMA EMA
Ngày tạo: 2024-11-29 17:02:33 sửa đổi lần cuối: 2024-11-29 17:02:33
sao chép: 2 Số nhấp chuột: 502
1
tập trung vào
1617
Người theo dõi

Chiến lược lọc biến động và theo dõi xu hướng đường tín hiệu động

Tổng quan

Chiến lược này là một hệ thống giao dịch tổng hợp kết hợp các đường tín hiệu động (DSL), tỷ lệ biến động và các chỉ số động. Chiến lược này xác định hiệu quả xu hướng thị trường thông qua các mức giảm động và các băng tần thích ứng tự động, và sử dụng các chỉ số động để lọc tín hiệu, để nắm bắt thời gian giao dịch chính xác. Hệ thống được thiết kế đầy đủ cơ chế quản lý rủi ro, bao gồm các mục tiêu dừng động và lợi nhuận dựa trên tỷ lệ lợi nhuận rủi ro.

Nguyên tắc chiến lược

Chiến lược này được xây dựng dựa trên 3 yếu tố chính:

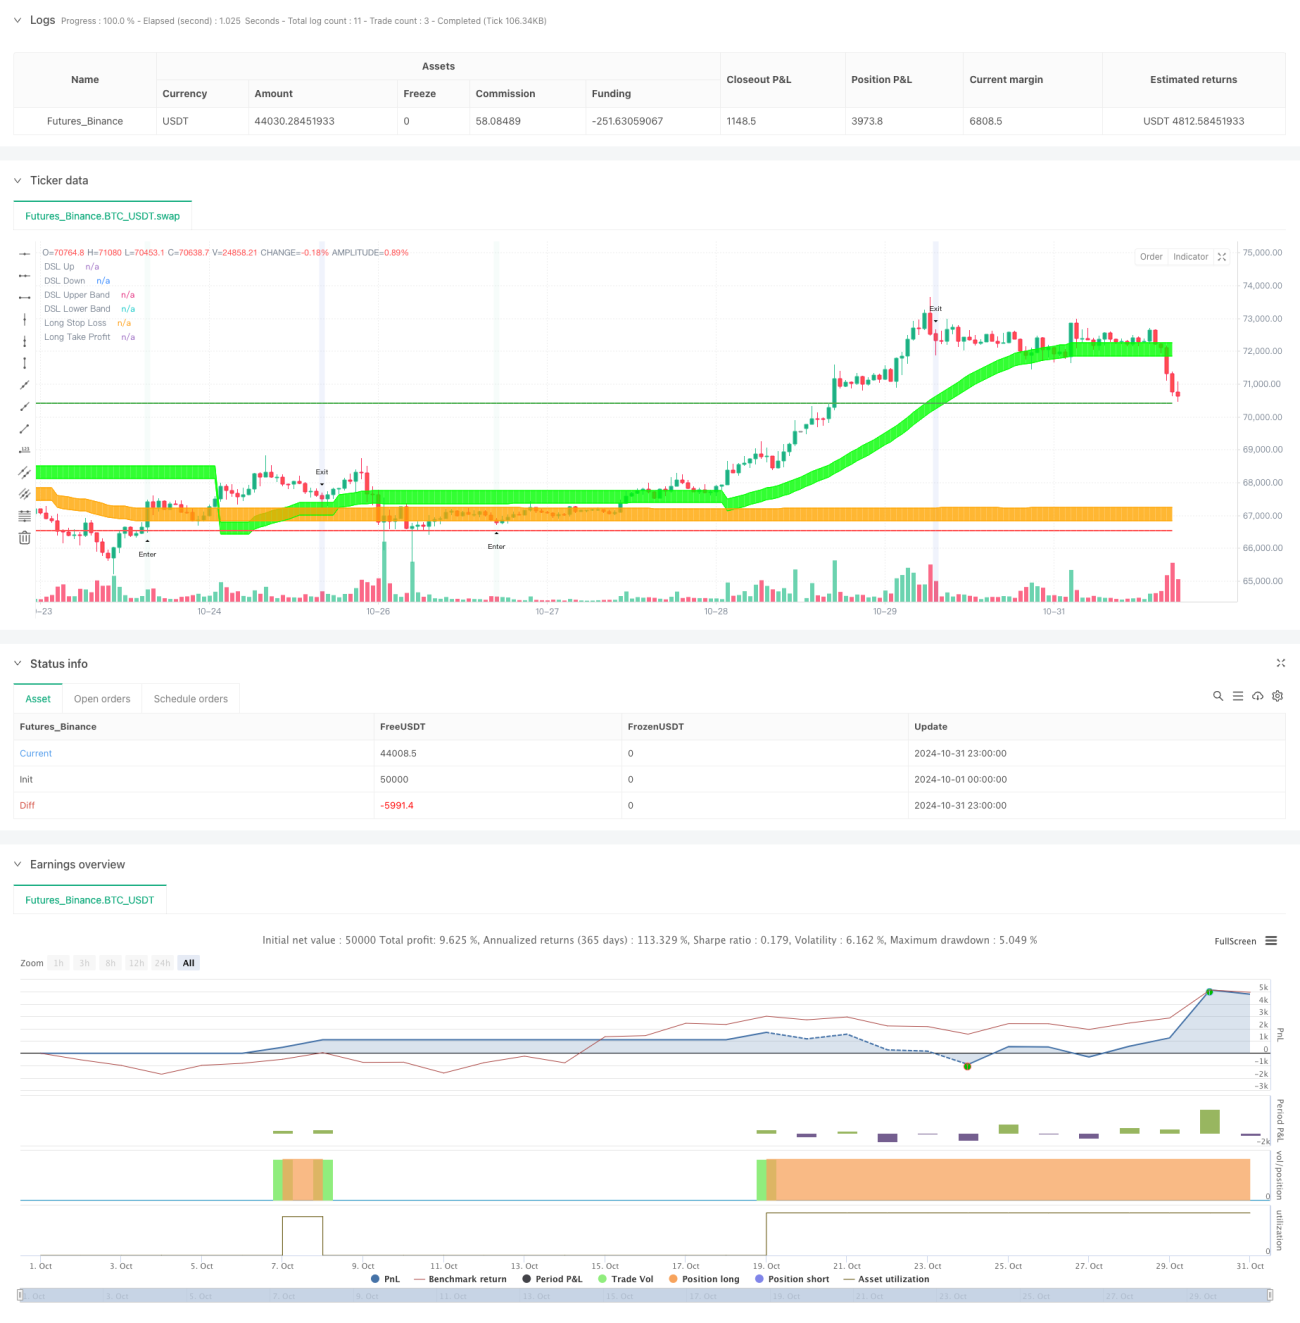
Đầu tiên là hệ thống đường tín hiệu động, bằng cách tính toán các đường quỹ đạo động dựa trên đường trung bình di chuyển. Các đường quỹ đạo này sẽ tự động điều chỉnh vị trí dựa trên các điểm cao và thấp gần đây của thị trường, để thực hiện theo dõi tự điều chỉnh xu hướng. Hệ thống cũng kết hợp với chỉ số ATR để xây dựng các dải sóng động để xác định cường độ xu hướng và thiết lập vị trí dừng lỗ.

Tiếp theo là hệ thống phân tích động lực, sử dụng các chỉ số RSI được tối ưu hóa bằng chỉ số di chuyển trung bình (ZLEMA) với độ trễ bằng không. Bằng cách áp dụng khái niệm đường tín hiệu động đến RSI, hệ thống có thể xác định chính xác hơn các khu vực quá mua quá bán và tạo ra tín hiệu phá vỡ động lực.

Thứ ba là cơ chế tích hợp tín hiệu. Một tín hiệu giao dịch phải đồng thời đáp ứng hai điều kiện xác nhận xu hướng và phá vỡ động lực để được kích hoạt. Nhiều đầu vào yêu cầu giá phá vỡ đường lên và duy trì trên đường, trong khi RSI phá vỡ đường tín hiệu động bên dưới.

Lợi thế chiến lược

  1. Khả năng thích ứng mạnh mẽ: Đường tín hiệu động và dải sóng sẽ tự động điều chỉnh theo tình trạng thị trường, cho phép chiến lược thích ứng với các môi trường thị trường khác nhau.
  2. Bộ lọc tín hiệu giả: Giảm đáng kể khả năng của tín hiệu giả bằng cách yêu cầu xác nhận xu hướng và động lực kép.
  3. Quản lý rủi ro hoàn thiện: tích hợp các mục tiêu dừng động dựa trên ATR và mục tiêu lợi nhuận dựa trên tỷ lệ lợi nhuận rủi ro, kiểm soát rủi ro có hệ thống.
  4. Tính linh hoạt và tùy chỉnh: Các tham số chiến lược có thể được điều chỉnh để tối ưu hóa cho các thị trường và chu kỳ thời gian khác nhau.

Rủi ro chiến lược

  1. Rủi ro đảo ngược xu hướng: Trong một sự đảo ngược mạnh mẽ của thị trường, việc điều chỉnh các đường tín hiệu động có thể không kịp thời, dẫn đến sự rút lui lớn hơn.
  2. Rủi ro thị trường dao động: Trong thị trường dao động trong khu vực, các vụ phá vỡ thường xuyên có thể dẫn đến nhiều lần dừng.
  3. Tính nhạy cảm của tham số: Hiệu suất của chiến lược rất nhạy cảm với cài đặt tham số, tham số không phù hợp có thể ảnh hưởng đến hiệu quả của chiến lược.

Hướng tối ưu hóa chiến lược

  1. Nhận dạng môi trường thị trường: Có thể thêm cơ chế phân loại môi trường thị trường, sử dụng các thiết lập tham số khác nhau trong các trạng thái thị trường khác nhau.
  2. Tối ưu hóa tham số động: giới thiệu cơ chế điều chỉnh tham số thích ứng, tự động tối ưu hóa các tham số đường tín hiệu và băng tần theo biến động của thị trường.
  3. Phân tích nhiều chu kỳ thời gian: tích hợp các tín hiệu của nhiều chu kỳ thời gian, tăng độ tin cậy của quyết định giao dịch.
  4. Chuyển đổi tỷ lệ biến động: điều chỉnh tỷ lệ dừng lỗ và lợi nhuận rủi ro trong thời gian biến động cao, tăng lợi nhuận sau khi điều chỉnh rủi ro của chiến lược.

Tóm tắt

Chiến lược này có khả năng nắm bắt hiệu quả các xu hướng thị trường thông qua sự kết hợp sáng tạo của các đường tín hiệu động và các chỉ số động. Cơ chế quản lý rủi ro và hệ thống lọc tín hiệu hoàn hảo giúp nó có giá trị ứng dụng thực tế mạnh mẽ. Bằng cách tối ưu hóa liên tục và điều chỉnh tham số, chiến lược có thể duy trì hiệu suất ổn định trong các môi trường thị trường khác nhau. Mặc dù có một số điểm rủi ro, nhưng những rủi ro này có thể được kiểm soát bằng cách đặt các tham số và các biện pháp kiểm soát rủi ro hợp lý.

Mã nguồn chiến lược
/*backtest
start: 2024-10-01 00:00:00
end: 2024-10-31 23:59:59
period: 1h
basePeriod: 1h
exchanges: [{"eid":"Futures_Binance","currency":"BTC_USDT"}]
*/

// This Pine Script™ code is subject to the terms of the Mozilla Public License 2.0 at https://mozilla.org/MPL/2.0/
// © DailyPanda

//@version=5
strategy("DSL Strategy [DailyPanda]",
     initial_capital = 2000,
     commission_value=0.00,
     slippage=3,
     overlay = true)

//--------------------------------------------------------------------------------------------------------------------
// USER INPUTS
//--------------------------------------------------------------------------------------------------------------------

// DSL Indicator Inputs CP
int   len         = input.int(34, "Length", group="CP")      // Length for calculating DSL
int   offset      = input.int(30, "Offset", group="CP")      // Offset for threshold levels
float width       = input.float(1, "Bands Width", step = 0.1, maxval = 2, minval = 0.5, group="CP") // Width for ATR-based bands
float risk_reward = input.float(1.5, "Risk Reward", group="Risk Mgmt") // Risk Reward ratio

// Colors for upper and lower trends
color upper_col = input.color(color.lime, "+", inline = "col")
color lower_col = input.color(color.orange, "-", inline = "col")

// DSL-BELUGA
len_beluga  = input.int(10, "Beluga Length", group="BELUGA")
dsl_mode_inp = input.string("Fast", "DSL Lines Mode", options=["Fast", "Slow"], group="BELUGA")
dsl_mode    = dsl_mode_inp == "Fast" ? 2 : 1

// Colors for DSL-BELUGA
color color_up = #8BD8BD
color color_dn = #436cd3

i_lossPct = input.int(defval=100, title="% max day DD", minval=1, maxval=100, step=1, group="Risk Management")
i_goal = input.bool(title="Enable Daily Goal", defval=false, group="Risk Management")
i_goalPct = input.int(defval=4, title="% Daily Goal", minval=1, step=1, group="Risk Management")


//############################## RISK MANAGEMENT ##############################
// Set maximum intraday loss to our lossPct input
// strategy.risk.max_intraday_loss(i_lossPct, strategy.percent_of_equity)
//strategy.risk.max_intraday_loss(value=1200, type=strategy.cash)

// Store equity value from the beginning of the day
eqFromDayStart = ta.valuewhen(ta.change(dayofweek) > 0, strategy.equity, 0)
// Calculate change of the current equity from the beginning of the current day
eqChgPct = 100 * ((strategy.equity - eqFromDayStart - strategy.openprofit) / (strategy.equity-strategy.openprofit))
f_stopGain = eqChgPct >= i_goalPct and i_goal ? true : false


//--------------------------------------------------------------------------------------------------------------------
// INDICATOR CALCULATIONS
//--------------------------------------------------------------------------------------------------------------------

// Function to calculate DSL lines based on price
dsl_price(float price, int len) =>
    // Initialize DSL lines
    float dsl_up = na
    float dsl_dn = na
    float sma    = ta.sma(price, len)

    // Dynamic upper and lower thresholds calculated with offset
    float threshold_up = ta.highest(len)[offset] 
    float threshold_dn = ta.lowest(len)[offset] 

    // Calculate the DSL upper and lower lines based on price compared to the thresholds
    dsl_up := price > threshold_up ? sma : nz(dsl_up[1]) 
    dsl_dn := price < threshold_dn ? sma : nz(dsl_dn[1])

    // Return both DSL lines
    [dsl_up, dsl_dn]

// Function to calculate DSL bands based on ATR and width multiplier
dsl_bands(float dsl_up, float dsl_dn) =>
    float atr = ta.atr(200) * width // ATR-based calculation for bands
    float upper = dsl_up - atr       // Upper DSL band
    float lower = dsl_dn + atr       // Lower DSL band

    [upper, lower]

// Get DSL values based on the closing price
[dsl_up, dsl_dn] = dsl_price(close, len)

// Calculate the bands around the DSL lines
[dsl_up1, dsl_dn1] = dsl_bands(dsl_up, dsl_dn)


//--------------------------------------------------------------------------------------------------------------------
// DSL-BELUGA INDICATOR CALCULATIONS
//--------------------------------------------------------------------------------------------------------------------

// Calculate RSI with a period of 10
float RSI = ta.rsi(close, 10)

// Zero-Lag Exponential Moving Average function
zlema(src, length) =>
    int   lag      = math.floor((length - 1) / 2)
    float ema_data = 2 * src - src[lag]
    float ema2     = ta.ema(ema_data, length)
    ema2

// Discontinued Signal Lines function
dsl_lines(src, length)=>
    float up  = 0.
    float dn  = 0.
    up := (src > ta.sma(src, length)) ? nz(up[1]) + dsl_mode / length * (src - nz(up[1])) : nz(up[1])  
    dn := (src < ta.sma(src, length)) ? nz(dn[1]) + dsl_mode / length * (src - nz(dn[1])) : nz(dn[1])
    [up, dn]

// Calculate DSL lines for RSI
[lvlu, lvld] = dsl_lines(RSI, len_beluga)

// Calculate DSL oscillator using ZLEMA of the average of upper and lower DSL Lines
float dsl_osc = zlema((lvlu + lvld) / 2, 10)

// Calculate DSL Lines for the oscillator
[level_up, level_dn] = dsl_lines(dsl_osc, 10)

// Detect crossovers for signal generation
bool up_signal = ta.crossover(dsl_osc, level_dn) and dsl_osc < 55
bool dn_signal = ta.crossunder(dsl_osc, level_up) and dsl_osc > 50

//--------------------------------------------------------------------------------------------------------------------
// VISUALIZATION
//--------------------------------------------------------------------------------------------------------------------

// Plot the DSL lines on the chart
plot_dsl_up = plot(dsl_up, color=color.new(upper_col, 80), linewidth=1, title="DSL Up")
plot_dsl_dn = plot(dsl_dn, color=color.new(lower_col, 80), linewidth=1, title="DSL Down")

// Plot the DSL bands
plot_dsl_up1 = plot(dsl_up1, color=color.new(upper_col, 80), linewidth=1, title="DSL Upper Band")
plot_dsl_dn1 = plot(dsl_dn1, color=color.new(lower_col, 80), linewidth=1, title="DSL Lower Band")

// Fill the space between the DSL lines and bands with color
fill(plot_dsl_up, plot_dsl_up1, color=color.new(upper_col, 80))
fill(plot_dsl_dn, plot_dsl_dn1, color=color.new(lower_col, 80))

// Plot signals on the chart
plotshape(up_signal, title="Buy Signal", style=shape.triangleup, location=location.belowbar, size=size.tiny, text="Enter")
plotshape(dn_signal, title="Sell Signal", style=shape.triangledown, location=location.abovebar, size=size.tiny, text="Exit")

// Color the background on signal occurrences
bgcolor(up_signal ? color.new(color_up, 90) : na, title="Up Signal Background", editable = false)
bgcolor(dn_signal ? color.new(color_dn, 90) : na, title="Down Signal Background", editable = false)

//--------------------------------------------------------------------------------------------------------------------
// STRATEGY CONDITIONS AND EXECUTION
//--------------------------------------------------------------------------------------------------------------------

// Variables to hold stop loss and take profit prices
var float long_stop_loss_price  = na
var float long_take_profit_price = na
var float short_stop_loss_price = na
var float short_take_profit_price = na
float pos_size = math.abs(strategy.position_size)

// Long Entry Conditions
bool long_condition1 = not na(dsl_up1) and not na(dsl_dn) and dsl_up1 > dsl_dn
bool long_condition2 = open > dsl_up and close > dsl_up and open[1] > dsl_up and close[1] > dsl_up and open[2] > dsl_up and close[2] > dsl_up
bool long_condition3 = up_signal and pos_size == 0
bool long_condition  = long_condition1 and long_condition2 and long_condition3 and (not f_stopGain)

// Short Entry Conditions
bool short_condition1 = not na(dsl_dn1) and not na(dsl_up) and dsl_dn < dsl_up1
bool short_condition2 = open < dsl_dn1 and close < dsl_dn1 and open[1] < dsl_dn1 and close[1] < dsl_dn1 and open[2] < dsl_dn1 and close[2] < dsl_dn1
bool short_condition3 = dn_signal and pos_size == 0
bool short_condition  = short_condition1 and short_condition2 and short_condition3 and (not f_stopGain)

// Long Trade Execution
if (long_condition and not na(dsl_up1))
    long_stop_loss_price := dsl_up1
    float risk = close - long_stop_loss_price
    if (risk > 0)
        long_take_profit_price := close + risk * risk_reward
        strategy.entry("Long", strategy.long)
        strategy.exit("Exit Long", from_entry="Long", stop=long_stop_loss_price, limit=long_take_profit_price)
else if (strategy.position_size <= 0)
    // Reset when not in a long position
    long_stop_loss_price  := na
    long_take_profit_price := na

// Short Trade Execution
if (short_condition and not na(dsl_dn1))
    short_stop_loss_price := dsl_dn1
    float risk = short_stop_loss_price - close
    if (risk > 0)
        short_take_profit_price := close - risk * risk_reward
        strategy.entry("Short", strategy.short)
        strategy.exit("Exit Short", from_entry="Short", stop=short_stop_loss_price, limit=short_take_profit_price)
else if (strategy.position_size >= 0)
    // Reset when not in a short position
    short_stop_loss_price := na
    short_take_profit_price := na

//--------------------------------------------------------------------------------------------------------------------
// PLOTTING STOP LOSS AND TAKE PROFIT LEVELS
//--------------------------------------------------------------------------------------------------------------------

// Plot the stop loss and take profit levels only when in a position
float plot_long_stop_loss   = strategy.position_size > 0 ? long_stop_loss_price : na
float plot_long_take_profit = strategy.position_size > 0 ? long_take_profit_price : na

float plot_short_stop_loss   = strategy.position_size < 0 ? short_stop_loss_price : na
float plot_short_take_profit = strategy.position_size < 0 ? short_take_profit_price : na

plot(plot_long_stop_loss, title="Long Stop Loss", color=color.red, linewidth=2, style=plot.style_linebr, editable=false)
plot(plot_long_take_profit, title="Long Take Profit", color=color.green, linewidth=2, style=plot.style_linebr, editable=false)

plot(plot_short_stop_loss, title="Short Stop Loss", color=color.red, linewidth=2, style=plot.style_linebr, editable=false)
plot(plot_short_take_profit, title="Short Take Profit", color=color.green, linewidth=2, style=plot.style_linebr, editable=false)