Hệ thống giao dịch theo đường trung bình động động lượng lai chuỗi kép

Tổng quan
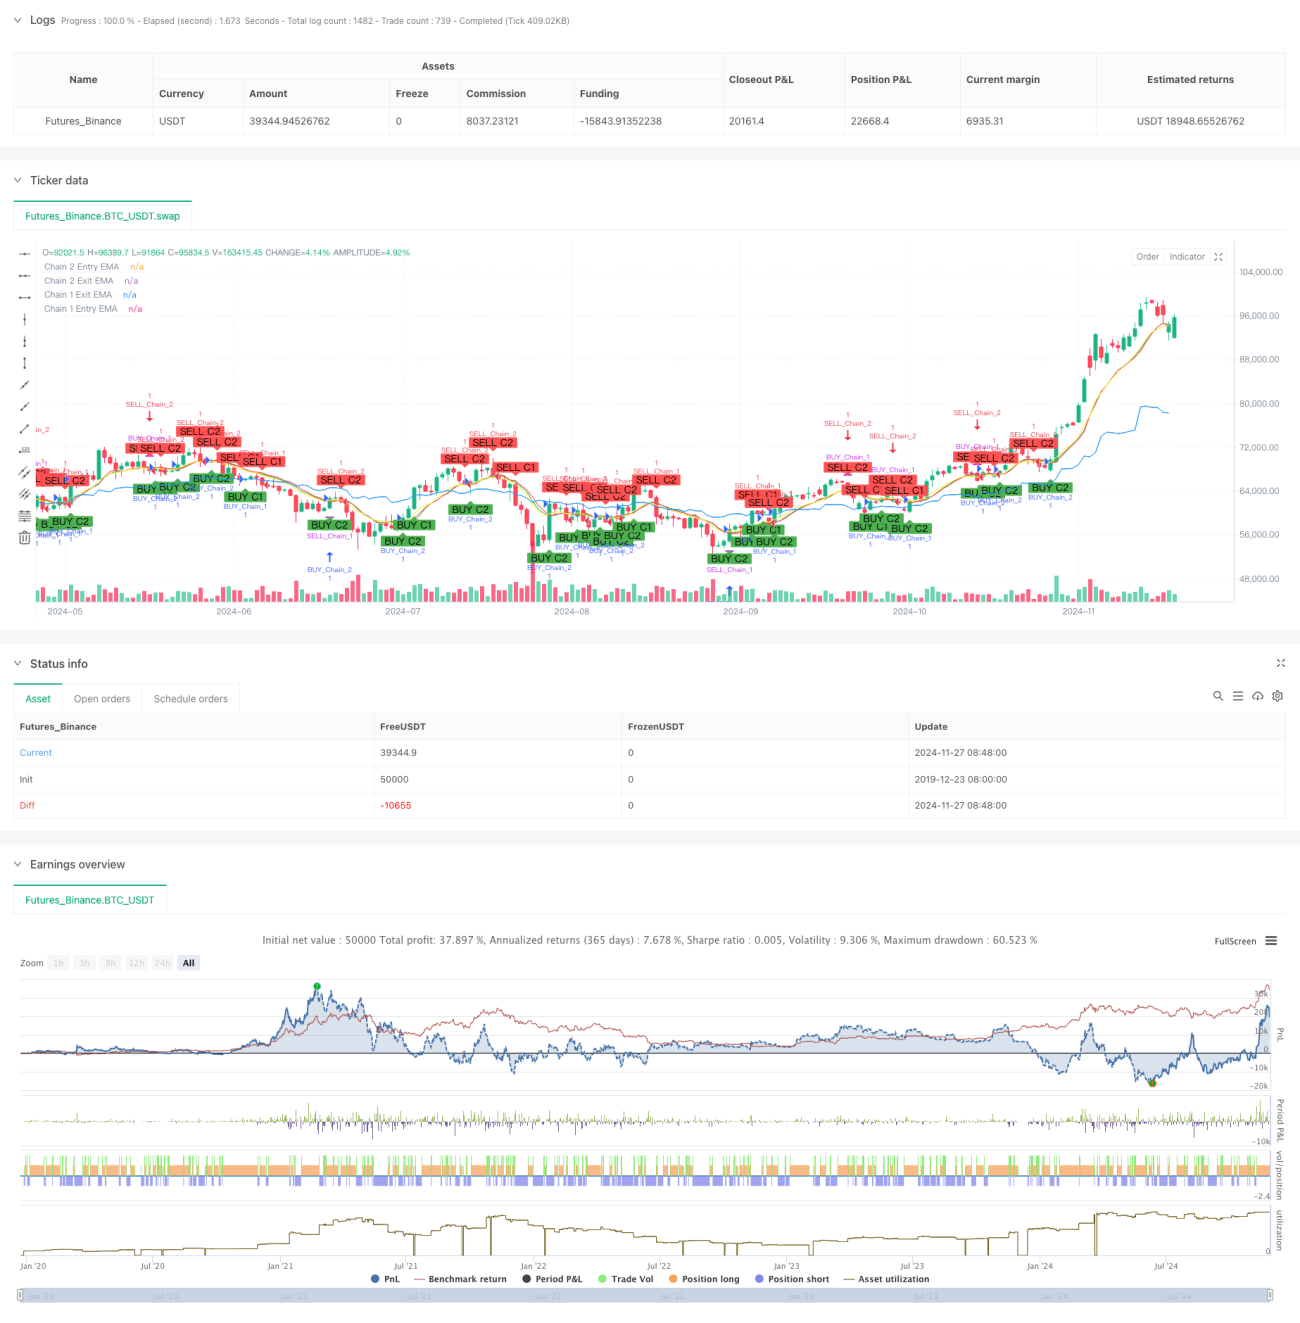
Chiến lược này là một hệ thống giao dịch sáng tạo dựa trên chỉ số trung bình di chuyển ((EMA) để nắm bắt cơ hội thị trường bằng cách thiết lập hai chuỗi giao dịch độc lập trong các chu kỳ thời gian khác nhau. Chiến lược này tích hợp các lợi thế của theo dõi xu hướng dài hạn và giao dịch động lượng ngắn hạn, tạo ra tín hiệu giao dịch bằng cách giao dịch trên nhiều chu kỳ thời gian như đường tuần, đường ngày, 12 giờ và 9 giờ, để phân tích và nắm bắt thị trường đa chiều.
Nguyên tắc chiến lược
Chiến lược sử dụng thiết kế chuỗi kép, mỗi chuỗi có logic nhập cảnh và xuất cảnh riêng:
Chuỗi 1 ((Trường hướng dài hạn) sử dụng chu kỳ đường tròn và ngày:
- Tín hiệu vào: tạo ra tín hiệu đa khi giá đóng cửa đi qua EMA trên chu kỳ vòng quay
- Tín hiệu xuất cảnh: Tín hiệu tháo lỗ được tạo ra khi giá đóng cửa đi qua EMA theo chu kỳ đường nhật
- Tính toán EMA mặc định là 10 và có thể điều chỉnh theo nhu cầu
Chuỗi 2 (động lực ngắn hạn) sử dụng chu kỳ 12 giờ và 9 giờ:
- Tín hiệu vào: tạo ra tín hiệu đa khi giá đóng cửa đi qua EMA trên chu kỳ 12 giờ
- Tín hiệu xuất cảnh: Tín hiệu tháo lỗ được tạo ra khi giá đóng cửa đi qua EMA theo chu kỳ 9 giờ
- Chu kỳ EMA mặc định là 9, có thể điều chỉnh theo nhu cầu
Lợi thế chiến lược
- Phân tích thị trường đa chiều: Nhận biết toàn diện về xu hướng thị trường thông qua sự kết hợp các chu kỳ thời gian khác nhau
- Tính linh hoạt: hai chuỗi có thể được bật hoặc tắt một cách độc lập, thích ứng với phong cách giao dịch khác nhau
- Kiểm soát rủi ro tốt: sử dụng xác nhận nhiều chu kỳ thời gian, giảm nguy cơ tín hiệu sai
- Các tham số có thể điều chỉnh được mạnh mẽ: cả chu kỳ EMA và chu kỳ thời gian có thể được sửa đổi theo nhu cầu
- Tính năng phản hồi được cải tiến: Cài đặt trong quá trình phản hồi được tích hợp, giúp xác minh và tối ưu hóa chiến lược
Rủi ro chiến lược
- Rủi ro thay đổi xu hướng: có thể bị tụt hậu trong thị trường biến động mạnh
- Rủi ro cấu hình chu kỳ thời gian: Các thị trường khác nhau có thể yêu cầu các kết hợp chu kỳ thời gian khác nhau
- Rủi ro tối ưu hóa tham số: tối ưu hóa quá mức có thể dẫn đến quá phù hợp
- Nguy cơ trùng lặp tín hiệu: hai chuỗi kích hoạt cùng một lúc có thể làm tăng rủi ro nắm giữ
Đề xuất kiểm soát rủi ro:
- Thiết lập mức dừng hợp lý
- Điều chỉnh tham số theo đặc điểm thị trường
- Đánh giá lại đầy đủ trước khi thực hiện
- Kiểm soát tỷ lệ vốn cho mỗi giao dịch
Hướng tối ưu hóa chiến lược
- Tối ưu hóa lọc tín hiệu:
- Thêm cơ chế xác nhận khối lượng
- Tiếp theo là các tín hiệu lọc của chỉ số dao động.
- Sự xác nhận tăng cường xu hướng
- Tối ưu hóa kiểm soát rủi ro:
- Phát triển cơ chế dừng lỗ động
- Thiết kế hệ thống quản lý kho
- Thêm chức năng kiểm soát rút lui
- Tối ưu hóa chu kỳ:
- Nghiên cứu về sự kết hợp chu kỳ thời gian tối ưu
- Phát triển cơ chế chu kỳ thời gian thích ứng
- Thêm chức năng nhận dạng trạng thái thị trường
Tóm tắt
Hệ thống giao dịch theo dõi đường trung bình hỗn hợp chuỗi kép kết hợp sáng tạo với chiến lược đường trung bình ngắn hạn dài, thực hiện phân tích và nắm bắt nhiều chiều của thị trường. Thiết kế hệ thống linh hoạt, có thể điều chỉnh theo các tình trạng thị trường khác nhau và phong cách của nhà giao dịch, có tính thực tế mạnh mẽ. Với kiểm soát rủi ro hợp lý và tối ưu hóa liên tục, chiến lược này có thể đạt được lợi nhuận ổn định trong giao dịch thực tế.
- 1