Chiến lược đột phá tam giác kết hợp với động lượng RSI

Tổng quan
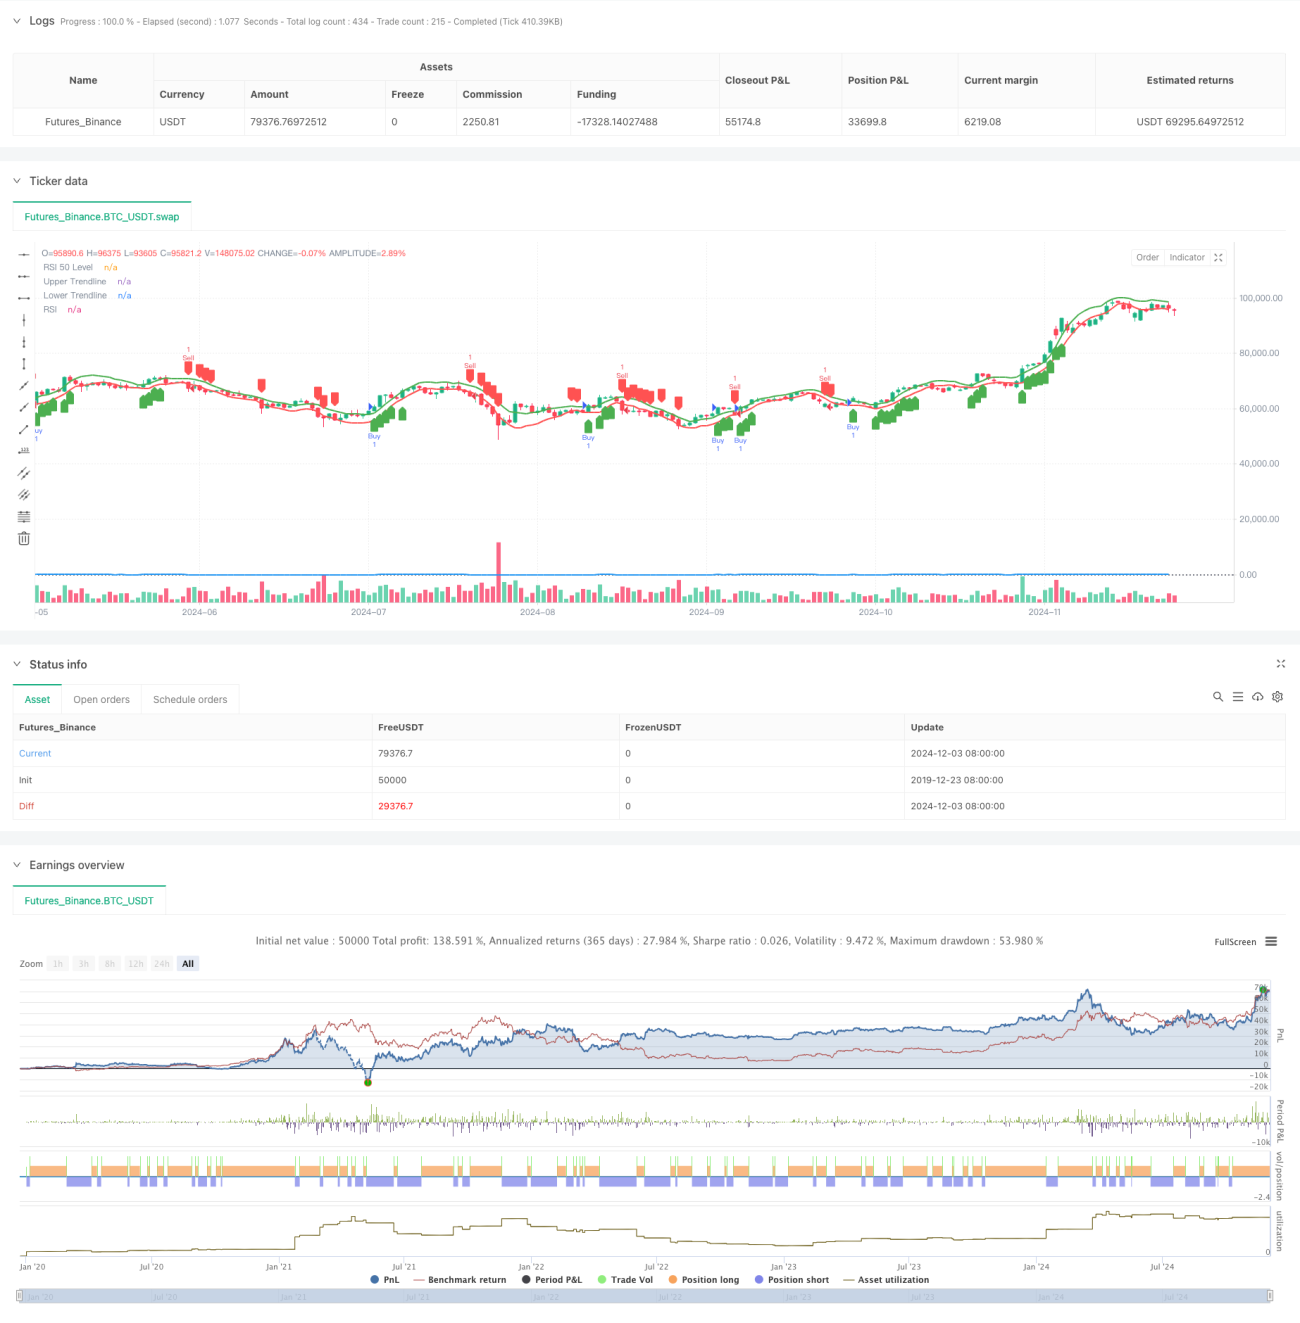
Chiến lược này là một hệ thống giao dịch định lượng dựa trên sự kết hợp giữa hình dạng giá và các chỉ số kỹ thuật. Nó chủ yếu được giao dịch bằng cách xác định các đột phá hình dạng tam giác và kết hợp với xác nhận động lực của chỉ số RSI. Chiến lược sử dụng phương pháp hồi quy tuyến tính để xây dựng đường xu hướng lên xuống, xác định tín hiệu giao dịch thông qua vị trí giá và RSI, thực hiện sự kết hợp hữu cơ của phân tích hình dạng với phân tích động lực.
Nguyên tắc chiến lược
Lịch lý cốt lõi của chiến lược bao gồm hai phần chính: nhận dạng hình dạng tam giác và xác nhận động lực RSI. Đầu tiên, sử dụng phương pháp hồi quy tuyến tính toán các điểm cao và thấp trong N chu kỳ gần đây nhất để xây dựng đường xu hướng lên xuống tạo thành tam giác.
Lợi thế chiến lược
- Cấu trúc rõ ràng: Chiến lược kết hợp phân tích hình dạng và phân tích động lực một cách hữu cơ, tăng độ tin cậy của giao dịch thông qua xác nhận kép.
- Tính linh hoạt của tham số: Cung cấp chiều dài tam giác có thể điều chỉnh và tham số chu kỳ RSI để tối ưu hóa cho các đặc điểm thị trường khác nhau.
- Khả năng hiển thị mạnh mẽ: hiển thị rõ ràng các đường xu hướng và tín hiệu giao dịch trên biểu đồ, giúp theo dõi chiến lược và phân tích phản hồi.
- Rủi ro có thể kiểm soát được: Bằng cách sử dụng RSI làm bộ lọc, bạn có thể giảm thiểu rủi ro của đột phá giả.
Rủi ro chiến lược
- Trong một tình huống chấn động, giao dịch có thể xảy ra thường xuyên, làm tăng chi phí giao dịch.
- Đường xu hướng được tính toán dựa trên dữ liệu lịch sử, có thể có sự chậm trễ trong thị trường biến động nhanh chóng.
- Chỉ số RSI có thể tạo ra tín hiệu giả trong một số điều kiện thị trường.
- Chiến lược không có cơ chế dừng lỗ, có thể chịu tổn thất lớn khi thị trường biến động mạnh.
Hướng tối ưu hóa chiến lược
- Tham gia vào cơ chế dừng lỗ: khuyến nghị thêm dừng cố định hoặc dừng di chuyển để kiểm soát rủi ro.
- Tối ưu hóa thời gian ra sân: Có thể xem xét tăng xác nhận số lượng giao dịch, tăng độ tin cậy của tín hiệu đột phá.
- Tạo bộ lọc tín hiệu: Bạn có thể thêm bộ lọc xu hướng để tránh giao dịch thường xuyên trên thị trường ngang.
- Tối ưu hóa các tham số động: Khuyến nghị điều chỉnh chiều dài của tam giác và ngưỡng RSI theo động thái biến động của thị trường.
Tóm tắt
Chiến lược đột phá tam giác kết hợp với động lực RSI là một hệ thống giao dịch định lượng có cấu trúc, logic rõ ràng. Bằng cách xác nhận cơ chế kép hình thức và động lực, hiệu quả nâng cao độ tin cậy của tín hiệu giao dịch. Mặc dù có một số rủi ro, nhưng thông qua các biện pháp tối ưu hóa tham số và kiểm soát rủi ro hợp lý, chiến lược này có giá trị thực tế tốt.
- 1