Chiến lược giao dịch năng động dựa trên các chỉ báo Bollinger Bands và RSI

Tổng quan
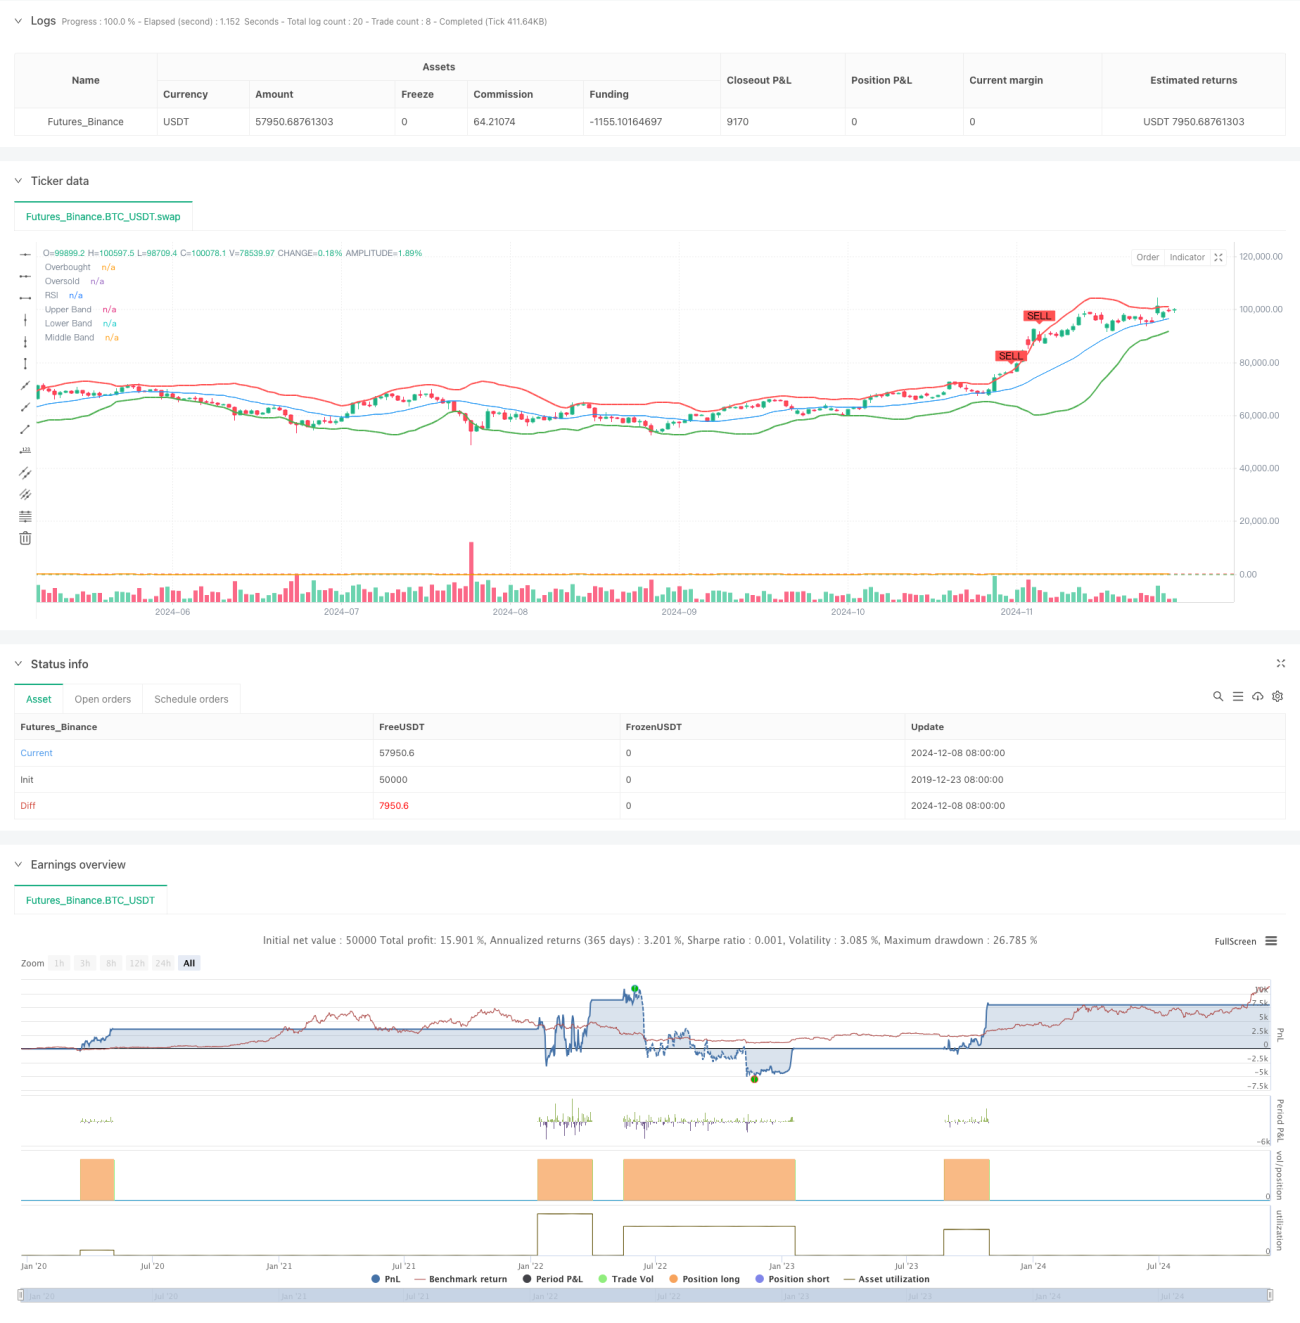
Chiến lược này là một hệ thống giao dịch tự điều chỉnh kết hợp các dải Bollinger Bands và chỉ số tương đối yếu RSI. Chiến lược này xác định các cơ hội giao dịch tiềm năng thông qua các kênh giá Bollinger Bands và tín hiệu mua bán quá mức của RSI để nắm bắt xu hướng và biến động của thị trường. Chiến lược này sử dụng các phân biệt tiêu chuẩn để điều chỉnh động giao dịch giữa các vùng và kết hợp với các mức mua bán quá mức của chỉ số RSI để xác nhận tín hiệu giao dịch, do đó cải thiện độ chính xác của giao dịch.
Nguyên tắc chiến lược
Trung tâm của chiến lược này là nắm bắt cơ hội biến động của thị trường bằng cách kết hợp các chỉ số RSI với đường quỹ đạo lên, giữa và xuống của Brin. Brin dựa trên trung bình di chuyển 20 chu kỳ và tính toán chênh lệch chuẩn gấp 2 lần. RSI sử dụng tính toán 14 chu kỳ, đặt 70 là mức quá mua và 30 là mức quá bán.
Lợi thế chiến lược
- Khả năng thích ứng: Binance có thể tự động điều chỉnh các khu vực giao dịch theo biến động của thị trường để thích ứng với các môi trường thị trường khác nhau.
- Tín hiệu đáng tin cậy: giảm đáng kể tín hiệu giả thông qua cơ chế xác nhận kép của Brin và RSI.
- Kiểm soát rủi ro: Tính toán chênh lệch tiêu chuẩn của Brin Belt cung cấp cơ chế kiểm soát rủi ro động.
- Hiệu ứng trực quan: Chiến lược cung cấp tín hiệu trực quan rõ ràng, dễ hiểu và dễ thực hiện cho nhà giao dịch.
- Tính linh hoạt: Các tham số chính có thể được điều chỉnh theo các đặc điểm thị trường khác nhau.
Rủi ro chiến lược
- Rủi ro của thị trường chấn động: Có thể có các tín hiệu phá vỡ giả thường xuyên trong thị trường chấn động ngang.
- Rủi ro bị tụt hậu: Các chỉ số trung bình di chuyển và RSI đều có một số rủi ro bị tụt hậu.
- Tính nhạy cảm của tham số: Các thiết lập tham số khác nhau có thể gây ra sự khác biệt lớn trong hiệu suất của chiến lược.
- Tùy thuộc vào môi trường thị trường: hoạt động tốt hơn trong thị trường có xu hướng rõ ràng, hiệu quả của thị trường chấn động có thể kém hơn.
Hướng tối ưu hóa chiến lược
- Thêm bộ lọc xu hướng: Thêm đường trung bình di chuyển dài hạn hoặc chỉ số xu hướng để lọc hướng giao dịch.
- Điều chỉnh tham số động: Điều chỉnh tự động các tham số của Brin và RSI theo biến động của thị trường.
- Tăng xác nhận lượng giao dịch: Thêm phân tích lượng giao dịch vào hệ thống tín hiệu
- Tối ưu hóa thiết lập dừng lỗ: giới thiệu cơ chế dừng động, chẳng hạn như dừng ATR hoặc dừng di chuyển phần trăm.
- Thêm bộ lọc thời gian: xem xét đặc điểm thời gian của thị trường và tránh giao dịch trong khoảng thời gian không phù hợp.
Tóm tắt
Chiến lược này xây dựng một hệ thống giao dịch tương đối hoàn chỉnh bằng cách sử dụng sự kết hợp của Brin và RSI. Ưu điểm của chiến lược là có thể thích ứng với biến động thị trường và cung cấp tín hiệu giao dịch đáng tin cậy, nhưng vẫn cần chú ý đến ảnh hưởng của môi trường thị trường đối với hiệu suất chiến lược.
- 1