Chiến lược định lượng giao thoa động lượng xu hướng đa chỉ báo

Tổng quan
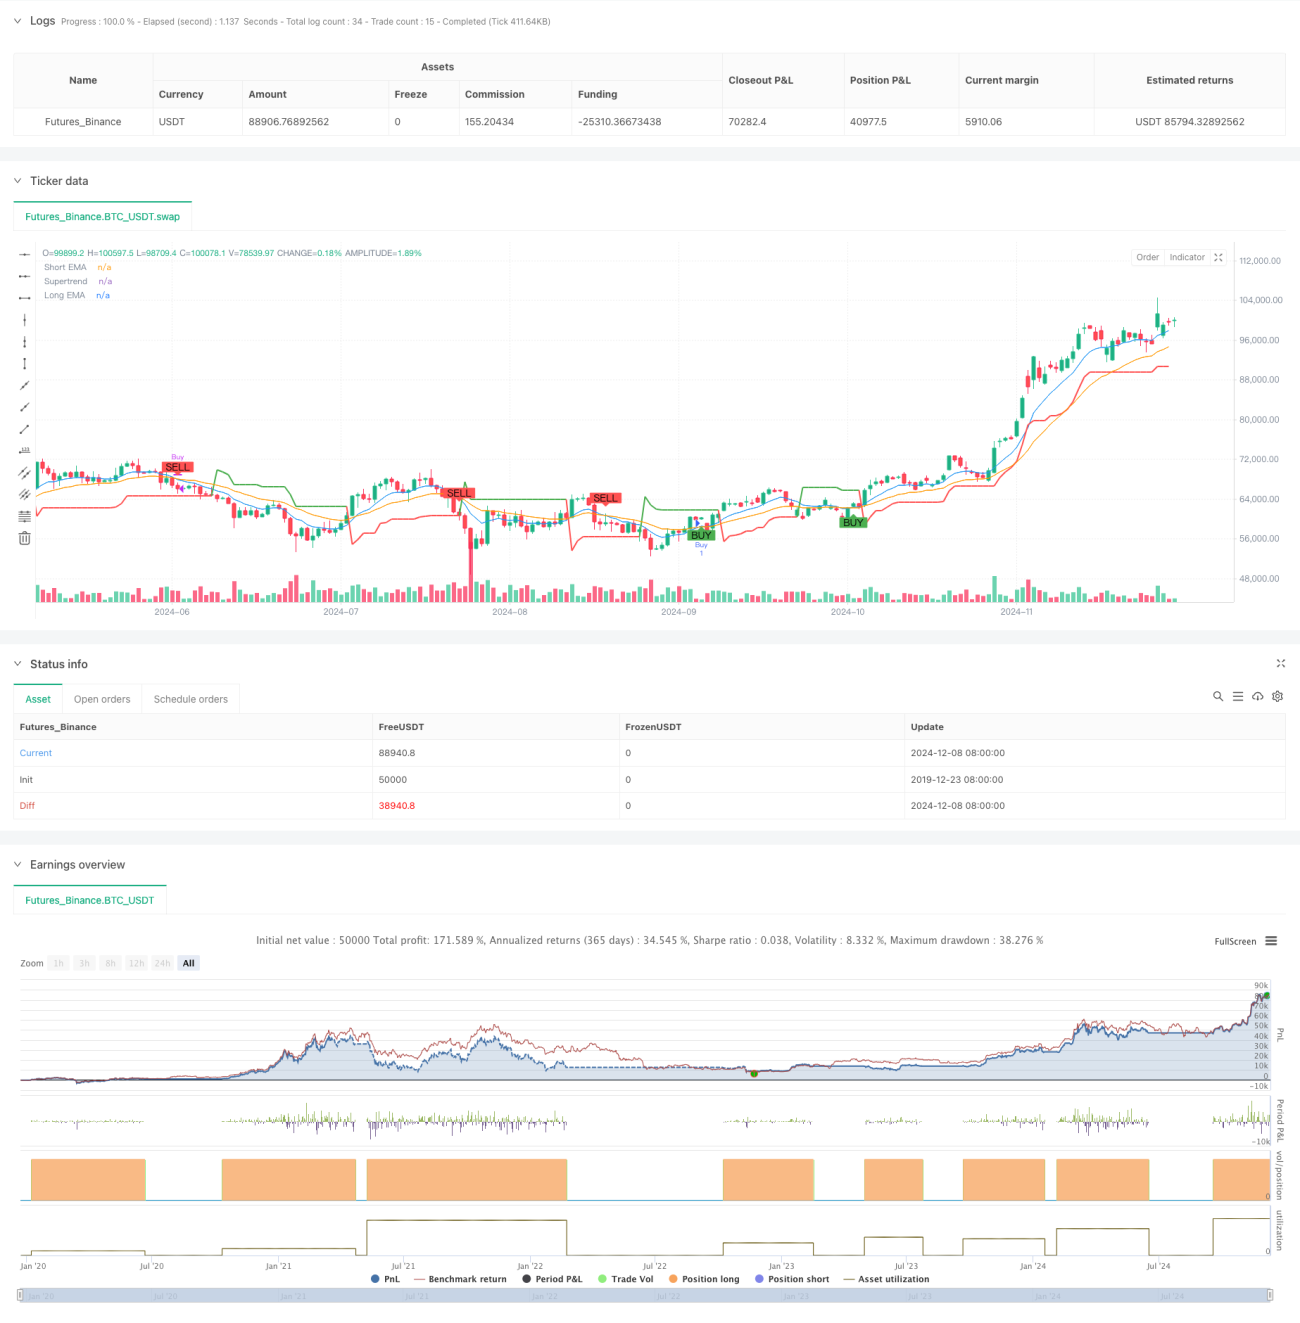
Đây là một chiến lược giao dịch đa chỉ số kết hợp Supertrend, chỉ số trung bình di chuyển ((EMA) và chỉ số tương đối mạnh ((RSI)). Chiến lược này sử dụng các tín hiệu chéo và mức độ mua bán quá mức của ba chỉ số kỹ thuật để xác định xu hướng, động lực và điểm đảo ngược tiềm năng của thị trường, để tìm kiếm cơ hội giao dịch lý tưởng trong thị trường. Chiến lược này tận dụng tối đa lợi thế của nhiều chỉ số để tăng độ chính xác và độ tin cậy của giao dịch thông qua phân tích thị trường theo các chiều khác nhau.
Nguyên tắc chiến lược
Lý luận cốt lõi của chiến lược dựa trên sự kết hợp của ba chỉ số kỹ thuật chính:
- Chỉ số Supertrend được sử dụng để xác định hướng xu hướng tổng thể, sử dụng ATR để điều chỉnh động đường xu hướng.
- Sự giao thoa của EMA ngắn hạn (vòng 9) và dài hạn (vòng 21) được sử dụng để nắm bắt sự thay đổi trong động thái giá.
- Chỉ số RSI được sử dụng để xác định thị trường đang quá mua hoặc quá bán.
Các tín hiệu mua phải đáp ứng các điều kiện sau:
- Chỉ số Supertrend cho thấy xu hướng đa đầu ((giá nằm trên đường Supertrend)
- EMA ngắn hạn tăng qua EMA dài hạn
- RSI chưa đạt mức mua quá mức (<70)
Các tín hiệu bán hàng phải đáp ứng các điều kiện sau:
- Chỉ số Supertrend cho thấy xu hướng không đầu ((giá nằm bên dưới đường Supertrend)
- EMA ngắn hạn đi xuống qua EMA dài hạn
- RSI chưa đạt mức bán tháo (trên 30)
Lợi thế chiến lược
- Xác nhận chéo đa chỉ số giúp tăng độ tin cậy tín hiệu
- Kết hợp các ưu điểm của theo dõi xu hướng và phân tích động lực
- RSI để lọc các tín hiệu giả tiềm ẩn
- Các tham số chiến lược có thể được điều chỉnh linh hoạt theo các điều kiện thị trường khác nhau
- Quy tắc nhập cảnh và xuất cảnh rõ ràng, giảm ảnh hưởng của phán đoán chủ quan
- Kiểm soát rủi ro tốt
Rủi ro chiến lược
- Tín hiệu sai thường xuyên có thể xảy ra trong thị trường biến động
- Sự chậm trễ của nhiều chỉ số có thể gây ra sự chậm trễ trong thời gian nhập cảnh và xuất cảnh
- Việc lựa chọn tham số không phù hợp có thể ảnh hưởng đến hiệu suất chiến lược
- Sự thay đổi đột ngột của thị trường có thể dẫn đến sự rút lui lớn hơn
- Cần xem xét tác động của chi phí giao dịch đến lợi nhuận chiến lược
Hướng tối ưu hóa chiến lược
- Giới thiệu cơ chế tham số thích ứng để điều chỉnh động các tham số chỉ báo theo biến động của thị trường
- Thêm các chỉ số phân tích giá trị, tăng độ tin cậy tín hiệu
- Phát triển mô-đun nhận diện môi trường thị trường, sử dụng các tổ hợp tham số khác nhau trong các môi trường thị trường khác nhau
- Tăng các cơ chế dừng lỗ và ngăn chặn, tối ưu hóa quản lý tài chính
- Xem xét thêm bộ lọc biến động để tránh giao dịch quá mức trong môi trường biến động thấp
Tóm tắt
Đây là một chiến lược giao dịch định lượng đa chỉ số có cấu trúc, logic rõ ràng, xây dựng một hệ thống giao dịch tương đối toàn diện bằng cách kết hợp theo dõi xu hướng, phân tích động lực và chỉ số mua bán quá mức. Ưu điểm của chiến lược là xác minh chéo đa chỉ số làm tăng độ tin cậy tín hiệu, đồng thời có cơ chế kiểm soát rủi ro rõ ràng. Mặc dù có một số rủi ro vốn có, nhưng bằng cách tối ưu hóa và hoàn thiện liên tục, chiến lược có thể duy trì hiệu suất ổn định trong các môi trường thị trường khác nhau.
/*backtest
start: 2019-12-23 08:00:00
end: 2024-12-09 08:00:00
period: 1d
basePeriod: 1d
exchanges: [{"eid":"Futures_Binance","currency":"BTC_USDT"}]
*/

// This Pine Script™ code is subject to the terms of the Mozilla Public License 2.0 at https://mozilla.org/MPL/2.0/
// © satyakipaul3744

//@version=6- 1