
Tổng quan
Chiến lược này là một hệ thống giao dịch theo dõi xu hướng kết hợp nhiều chỉ số kỹ thuật. Nó giao dịch khi xu hướng thị trường rõ ràng bằng cách tích hợp nhiều chỉ số kỹ thuật như RSI (chỉ số tương đối mạnh), MACD (chỉ số trung bình di chuyển) và SMA (chỉ số di chuyển đơn giản). Chiến lược cũng bao gồm các cơ chế quản lý rủi ro như dừng, dừng lỗ và theo dõi dừng lỗ để quản lý tài chính tốt hơn.
Nguyên tắc chiến lược
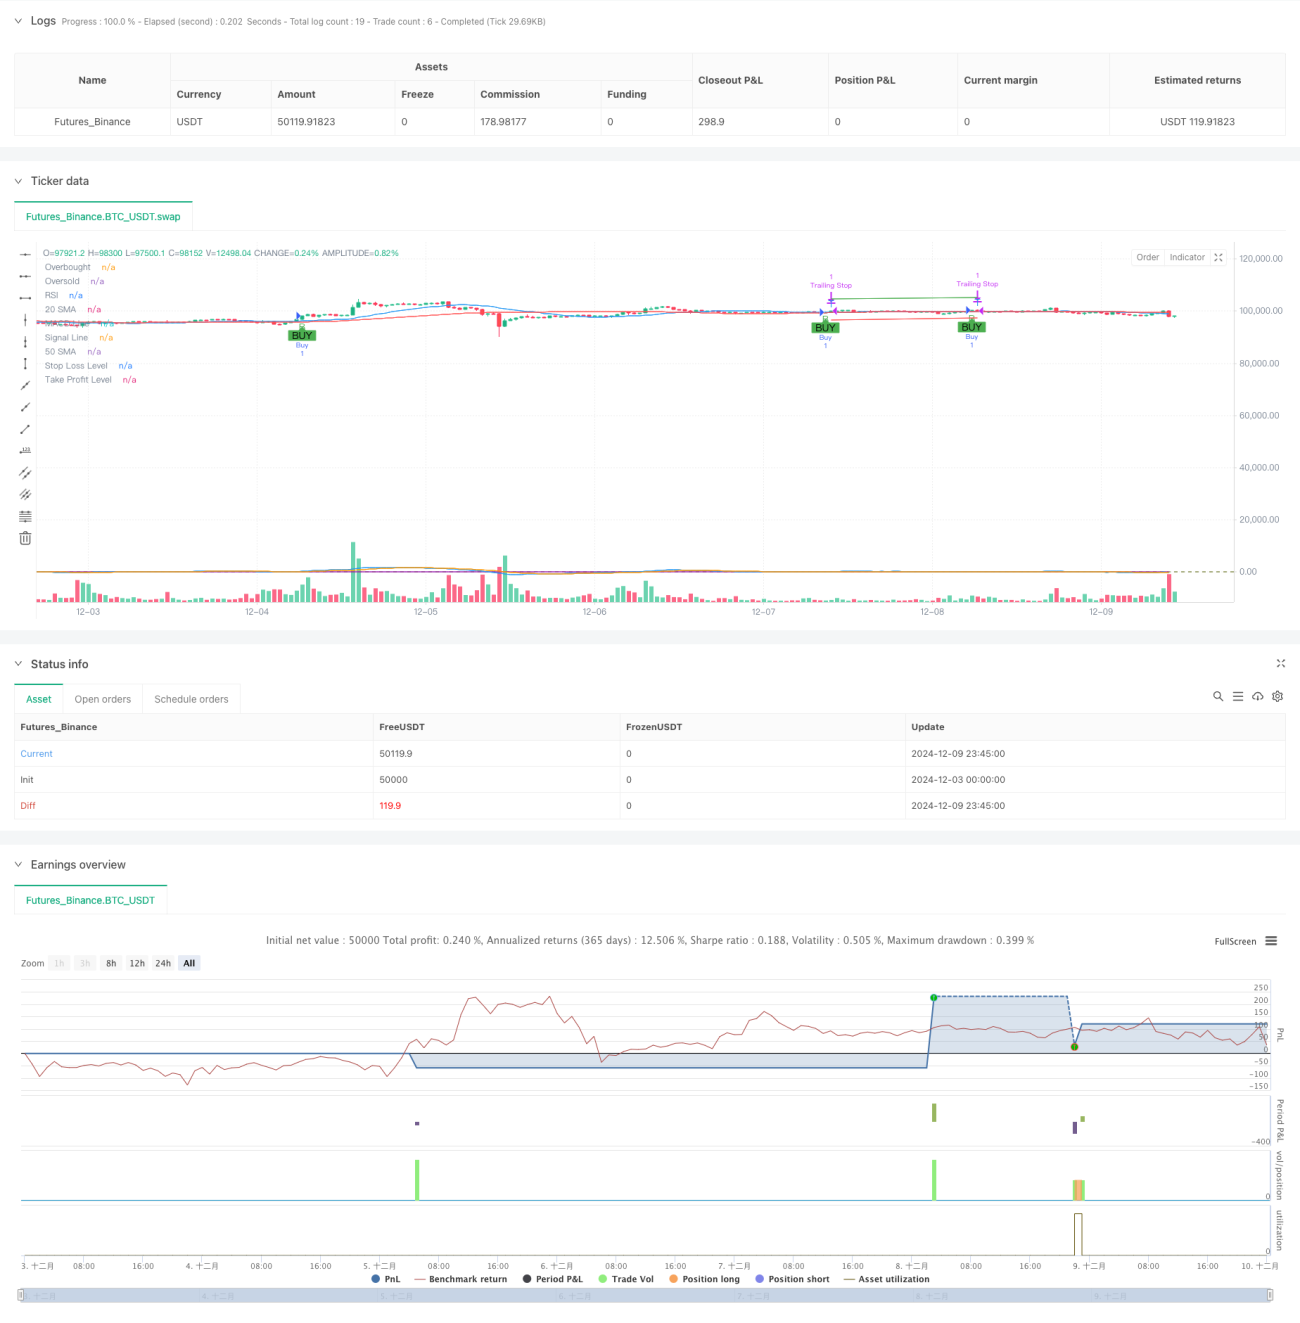
Chiến lược này được sử dụng để giao dịch dựa trên các điều kiện cốt lõi sau:
- Chỉ số MACD xuất hiện lò xo (trong đường MACD có đường tín hiệu)
- Chỉ số RSI dưới 70, tránh khu vực mua quá mức
- Giá nằm trên đường trung bình ngắn hạn (đường trung bình 20 ngày)
- Đường trung bình ngắn hạn nằm trên đường trung bình dài hạn (đường trung bình 50 ngày)
Khi các điều kiện trên được đáp ứng cùng một lúc, hệ thống sẽ phát ra nhiều tín hiệu. Trong khi đó, chiến lược đặt mục tiêu dừng lại 5%, giới hạn dừng lỗ 3%, và dừng theo dõi 2% để bảo vệ lợi nhuận đã đạt được. Thiết kế điều kiện giao dịch nhiều tầng này giúp tăng độ chính xác và an toàn của giao dịch.
Lợi thế chiến lược
- Việc sử dụng tổng hợp các chỉ số kỹ thuật đa dạng giúp tăng độ tin cậy của tín hiệu giao dịch
- RSI lọc khu vực mua quá mức để tránh nhập cảnh ở mức cao
- Việc sử dụng hệ thống đường trung bình giúp xác nhận xu hướng trung và dài hạn
- Cơ chế quản lý rủi ro tốt, bao gồm dừng cố định và theo dõi dừng
- Các tham số chiến lược có thể được điều chỉnh linh hoạt để phù hợp với các môi trường thị trường khác nhau
- Khoảng thời gian giao dịch có thể được tùy chỉnh để dễ dàng tra lại và ứng dụng trên nền tảng
Rủi ro chiến lược
- Nhiều chỉ số có thể làm chậm tín hiệu và ảnh hưởng đến thời gian nhập cảnh
- Tín hiệu sai có thể xảy ra trong thị trường biến động
- Tỷ lệ Stop Loss cố định có thể không phù hợp với tất cả các điều kiện thị trường
- Theo dõi dừng lỗ có thể thoát khỏi lợi nhuận sớm khi thị trường biến động lớn
Các biện pháp giảm thiểu bao gồm: điều chỉnh các tham số chỉ số một cách thích hợp, điều chỉnh tỷ lệ dừng lỗ theo các đặc điểm thị trường khác nhau, tăng bộ lọc môi trường thị trường, v.v.
Hướng tối ưu hóa chiến lược
- Tiến hành các chỉ số tỷ lệ dao động (như ATR), làm cho stop loss có tính thích ứng hơn
- Tăng hiệu quả tín hiệu xác thực của chỉ số giao dịch
- Thêm cơ chế đánh giá môi trường thị trường, sử dụng các tham số khác nhau trong các điều kiện thị trường khác nhau
- Tối ưu hóa các tham số MACD để cải thiện tính kịp thời của tín hiệu
- Xem xét thêm tín hiệu quay ngược để thực hiện chức năng làm không khí
Các biện pháp tối ưu hóa này giúp cải thiện khả năng thích ứng và ổn định của chiến lược.
Tóm tắt
Chiến lược này tạo ra một hệ thống giao dịch tương đối hoàn hảo bằng cách sử dụng kết hợp nhiều chỉ số kỹ thuật. Nó không chỉ chứa các logic cốt lõi để theo dõi xu hướng mà còn tích hợp các cân nhắc quản lý rủi ro. Mặc dù có một số nơi cần được tối ưu hóa, nhưng khung tổng thể có khả năng mở rộng và thích ứng tốt. Việc sử dụng chiến lược thành công đòi hỏi các nhà giao dịch tối ưu hóa tham số và cải tiến chiến lược theo tình hình thị trường thực tế.
- 1