
Tổng quan
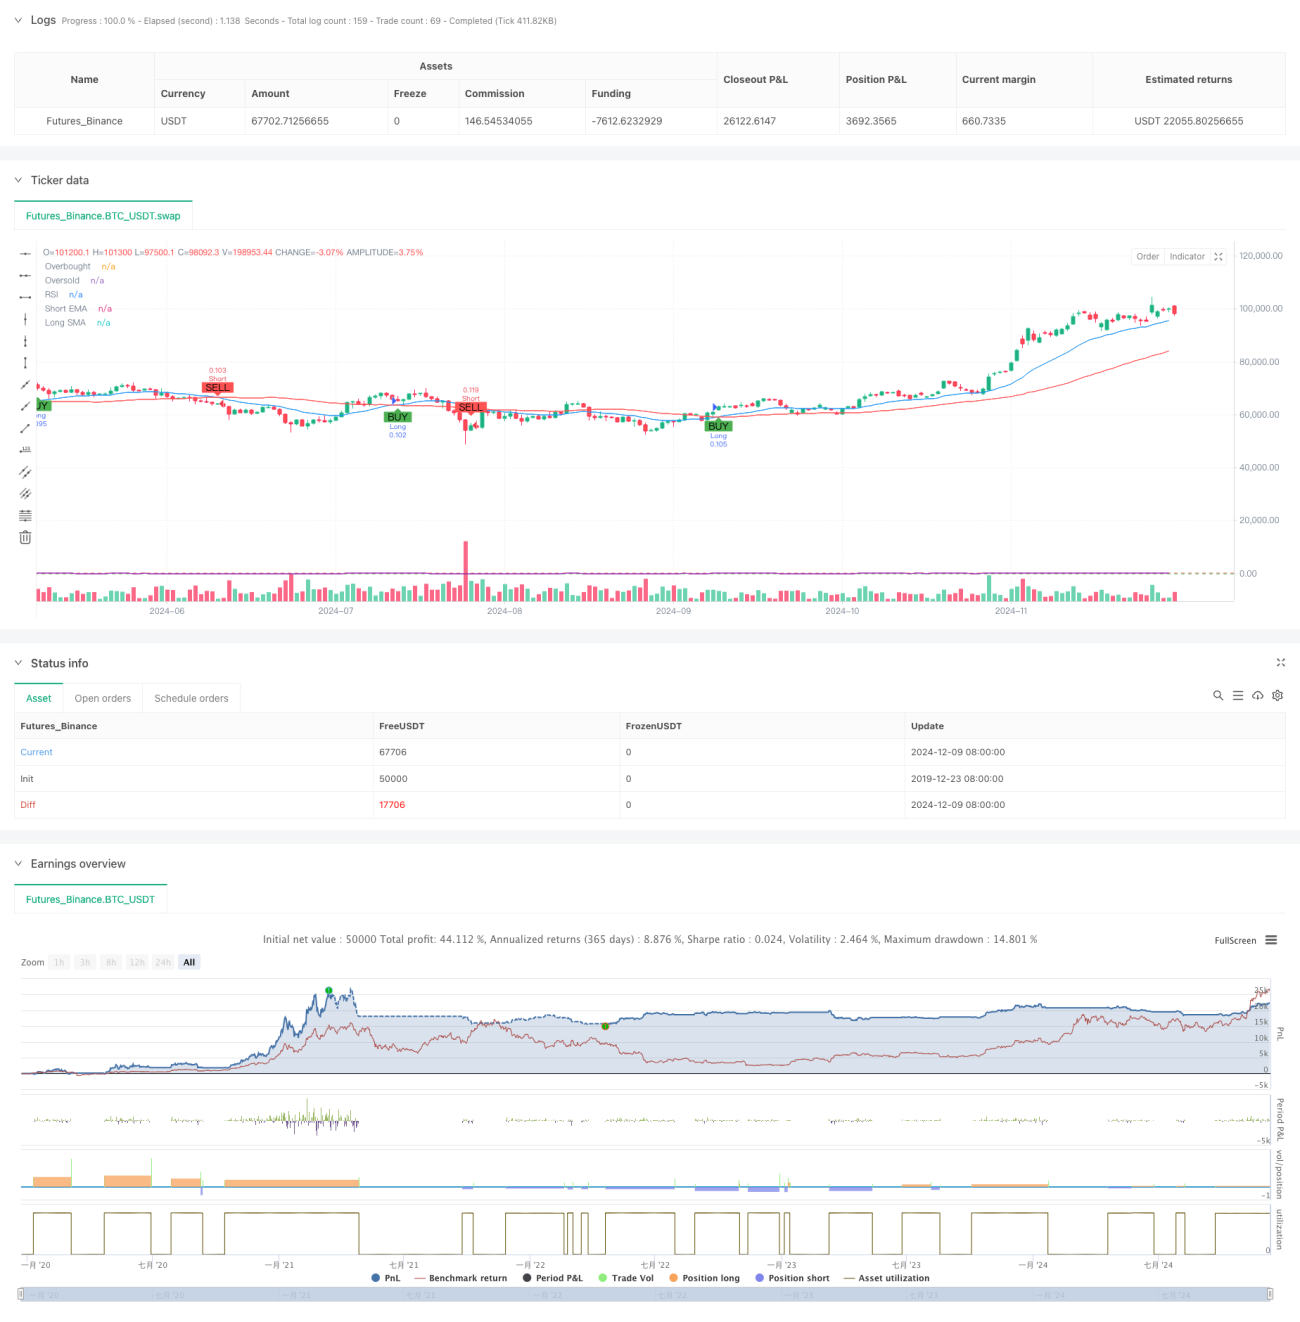
Chiến lược này là một chiến lược giao dịch biến động dựa trên các chỉ số kỹ thuật, kết hợp nhiều tín hiệu như giao thoa ngang, RSI overbought and oversold và ATR stop loss. Cốt lõi của chiến lược là để nắm bắt xu hướng thị trường thông qua giao thoa của EMA ngắn hạn và SMA dài hạn, đồng thời sử dụng chỉ số RSI để xác nhận tín hiệu và thiết lập các vị trí dừng và dừng thông qua ATR. Chiến lược hỗ trợ giao dịch hai chiều đa chiều và có thể bật hoặc tắt một chiều theo sở thích của người dùng.
Nguyên tắc chiến lược
Chiến lược xây dựng hệ thống giao dịch bằng cách sử dụng nhiều lớp kết hợp các chỉ số kỹ thuật:
- Lớp phán đoán xu hướng: Sử dụng giao chéo của 20 chu kỳ EMA và 50 chu kỳ SMA để đánh giá hướng xu hướng, trên EMA đeo SMA được coi là tín hiệu đa và dưới là tín hiệu trống.
- Lớp xác nhận động lực: Sử dụng chỉ số RSI để đánh giá quá mua quá bán, RSI cho phép mua nhiều hơn khi thấp hơn 70 và cho phép mua ít hơn khi cao hơn 30
- Lớp tính toán biến động: Sử dụng 14 chu kỳ ATR để tính toán vị trí dừng lỗ, thiết lập dừng lỗ là 1,5 lần ATR, thiết lập dừng lỗ là 3 lần ATR.
- Quản lý vị trí: Tính năng tính toán số lượng vị trí mở dựa trên số tiền ban đầu và tỷ lệ rủi ro cho mỗi giao dịch (bằng mặc định là 1%).
Lợi thế chiến lược
- Xác nhận tín hiệu đa: Giảm hiệu quả nhiễu tín hiệu giả bằng cách kết hợp các chỉ số ba RSI và ATR.
- Động thái dừng lỗ: Động thái điều chỉnh vị trí dừng lỗ dựa trên ATR để thích ứng tốt hơn với sự biến động của thị trường.
- Định hướng giao dịch linh hoạt: có thể kích hoạt giao dịch đa đầu hoặc đầu không tùy thuộc vào môi trường thị trường.
- Kiểm soát rủi ro nghiêm ngặt: Kiểm soát hiệu quả các lỗ hổng rủi ro cho mỗi giao dịch thông qua kiểm soát rủi ro phần trăm và quản lý vị trí động.
- Hỗ trợ hình ảnh: Chiến lược cung cấp hỗ trợ hình ảnh biểu đồ đầy đủ, bao gồm đánh dấu tín hiệu và hiển thị chỉ số.
Rủi ro chiến lược
- Rủi ro của thị trường chấn động: Trong thị trường chấn động theo chiều ngang, đường trung bình có thể tạo ra quá nhiều tín hiệu giả.
- Rủi ro trượt: Trong thời gian biến động mạnh, giá giao dịch thực tế có thể có sai lệch lớn so với giá tín hiệu.
- Rủi ro quản lý tiền: Nếu bạn đặt tỷ lệ rủi ro quá cao, nó có thể dẫn đến tổn thất đơn lẻ quá lớn.
- Tính nhạy cảm của tham số: hiệu ứng chiến lược nhạy cảm với các thiết lập tham số, cần điều chỉnh cẩn thận.
Hướng tối ưu hóa chiến lược
- Thêm bộ lọc cường độ xu hướng: Bạn có thể thêm chỉ số ADX để lọc tín hiệu giao dịch trong môi trường xu hướng yếu.
- Tối ưu hóa chu kỳ trung bình: có thể điều chỉnh động các tham số trung bình theo các đặc điểm chu kỳ thị trường khác nhau.
- Cải thiện cơ chế dừng lỗ: có thể thêm chức năng theo dõi dừng lỗ và bảo vệ lợi nhuận tốt hơn.
- Tăng xác nhận số lượng giao dịch: Thêm chỉ số số lượng giao dịch làm xác nhận phụ trợ, tăng độ tin cậy tín hiệu.
- Phân loại môi trường thị trường: thêm mô-đun nhận diện môi trường thị trường, sử dụng các tổ hợp tham số khác nhau trong các môi trường thị trường khác nhau.
Tóm tắt
Chiến lược này xây dựng một hệ thống giao dịch tương đối hoàn chỉnh thông qua việc sử dụng kết hợp nhiều chỉ số kỹ thuật. Ưu điểm của chiến lược là độ tin cậy của tín hiệu xác nhận và tính toàn vẹn của quản lý rủi ro, nhưng cũng cần chú ý đến tác động của môi trường thị trường đối với hiệu suất của chiến lược.
/*backtest
start: 2019-12-23 08:00:00
end: 2024-12-10 08:00:00
period: 1d
basePeriod: 1d
exchanges: [{"eid":"Futures_Binance","currency":"BTC_USDT"}]
*/

// This Pine Script™ code is subject to the terms of the Mozilla Public License 2.0 at https://mozilla.org/MPL/2.0/
// © CryptoRonin84

//@version=5- 1