
Tổng quan
Chiến lược này là một hệ thống giao dịch thông minh dựa trên chỉ số sức mạnh tương đối (RSI), kết hợp nhiều đường trung bình động và chỉ báo Bollinger Bands, nhằm thực hiện giao dịch theo thời điểm bằng cách xác định vùng quá mua và quá bán của thị trường. Cốt lõi của chiến lược là sử dụng tín hiệu phá vỡ và hồi phục của RSI, kết hợp với các loại đường trung bình động khác nhau để xác nhận xu hướng, từ đó thực hiện các giao dịch sóng hiệu quả. Chiến lược có khả năng thích ứng cao, có thể điều chỉnh tham số theo các điều kiện thị trường khác nhau.
Nguyên lý chiến lược
Chiến lược sử dụng RSI chu kỳ 14 làm chỉ báo cốt lõi, tạo tín hiệu giao dịch dựa trên sự giao cắt của RSI với hai mức quan trọng 30 và 70. Khi RSI phá vỡ lên trên 30, hệ thống cho rằng thị trường chuyển từ quá bán sang tăng giá, kích hoạt tín hiệu mua (long); khi RSI phá vỡ xuống dưới 70, hệ thống đánh giá thị trường chuyển từ quá mua sang giảm giá, kích hoạt tín hiệu đóng vị thế. Đồng thời, chiến lược đưa vào nhiều loại đường trung bình (SMA, EMA, SMMA, WMA, VWMA) và Bollinger Bands làm chỉ báo phụ trợ, dùng để xác nhận hướng xu hướng và mức độ biến động thị trường.
Ưu điểm chiến lược
- Tín hiệu rõ ràng: Tín hiệu quá mua/quá bán của RSI rõ ràng, dễ hiểu và dễ thực hiện.
- Rủi ro có thể kiểm soát: Bằng cách đặt điều kiện vào và ra rõ ràng, kiểm soát rủi ro hiệu quả.
- Tính linh hoạt cao: Hỗ trợ nhiều loại đường trung bình, có thể linh hoạt chuyển đổi tùy theo điều kiện thị trường.
- Tính thích ứng: Bollinger Bands có thể tự động điều chỉnh vùng giao dịch dựa trên biến động thị trường.
- Dễ tối ưu hóa: Các tham số có khả năng điều chỉnh cao, dễ dàng tối ưu hóa theo các điều kiện thị trường khác nhau.
Rủi ro chiến lược
- Rủi ro thị trường đi ngang: Trong thị trường dao động ngang có thể tạo ra nhiều tín hiệu phá vỡ giả.
- Rủi ro xu hướng kéo dài: Đóng vị thế quá sớm có thể bỏ lỡ xu hướng lớn.
- Nhạy cảm với tham số: Các cài đặt tham số khác nhau có thể dẫn đến kết quả chiến lược khác biệt đáng kể.
- Ảnh hưởng của trượt giá: Ở thị trường kém thanh khoản có thể đối mặt với độ trượt lớn.
- Rủi ro hệ thống: Trong điều kiện thị trường cực đoan có thể xảy ra cắt lỗ liên tiếp.
Hướng tối ưu hóa chiến lược
- Đưa vào chỉ báo khối lượng: Xác nhận tính hiệu quả của tín hiệu bằng khối lượng giao dịch.
- Thêm bộ lọc xu hướng: Kết hợp phán đoán xu hướng dài hạn hơn để tránh giao dịch ngược xu hướng.
- Tối ưu cơ chế dừng lỗ: Đưa vào dừng lỗ động để nâng cao hiệu suất sử dụng vốn.
- Hoàn thiện quản lý vị thế: Điều chỉnh kích thước vị thế linh hoạt dựa trên biến động thị trường.
- Thêm chỉ báo tâm lý thị trường: Kết hợp các chỉ báo kỹ thuật khác để nâng cao độ chính xác của tín hiệu.
Tổng kết
Chiến lược này nắm bắt cơ hội quá mua/quá bán của thị trường thông qua chỉ báo RSI, kết hợp nhiều chỉ báo kỹ thuật để xác nhận tín hiệu, có tính thực tiễn và độ tin cậy cao. Thiết kế chiến lược cân nhắc đầy đủ đến kiểm soát rủi ro, thông qua tối ưu hóa tham số và kết hợp các chỉ báo có thể thích ứng với các điều kiện thị trường khác nhau. Khuyến nghị các nhà giao dịch thực hiện kiểm tra lại (backtest) đầy đủ trước khi sử dụng thực chiến, và điều chỉnh tham số theo đặc điểm thị trường cụ thể.
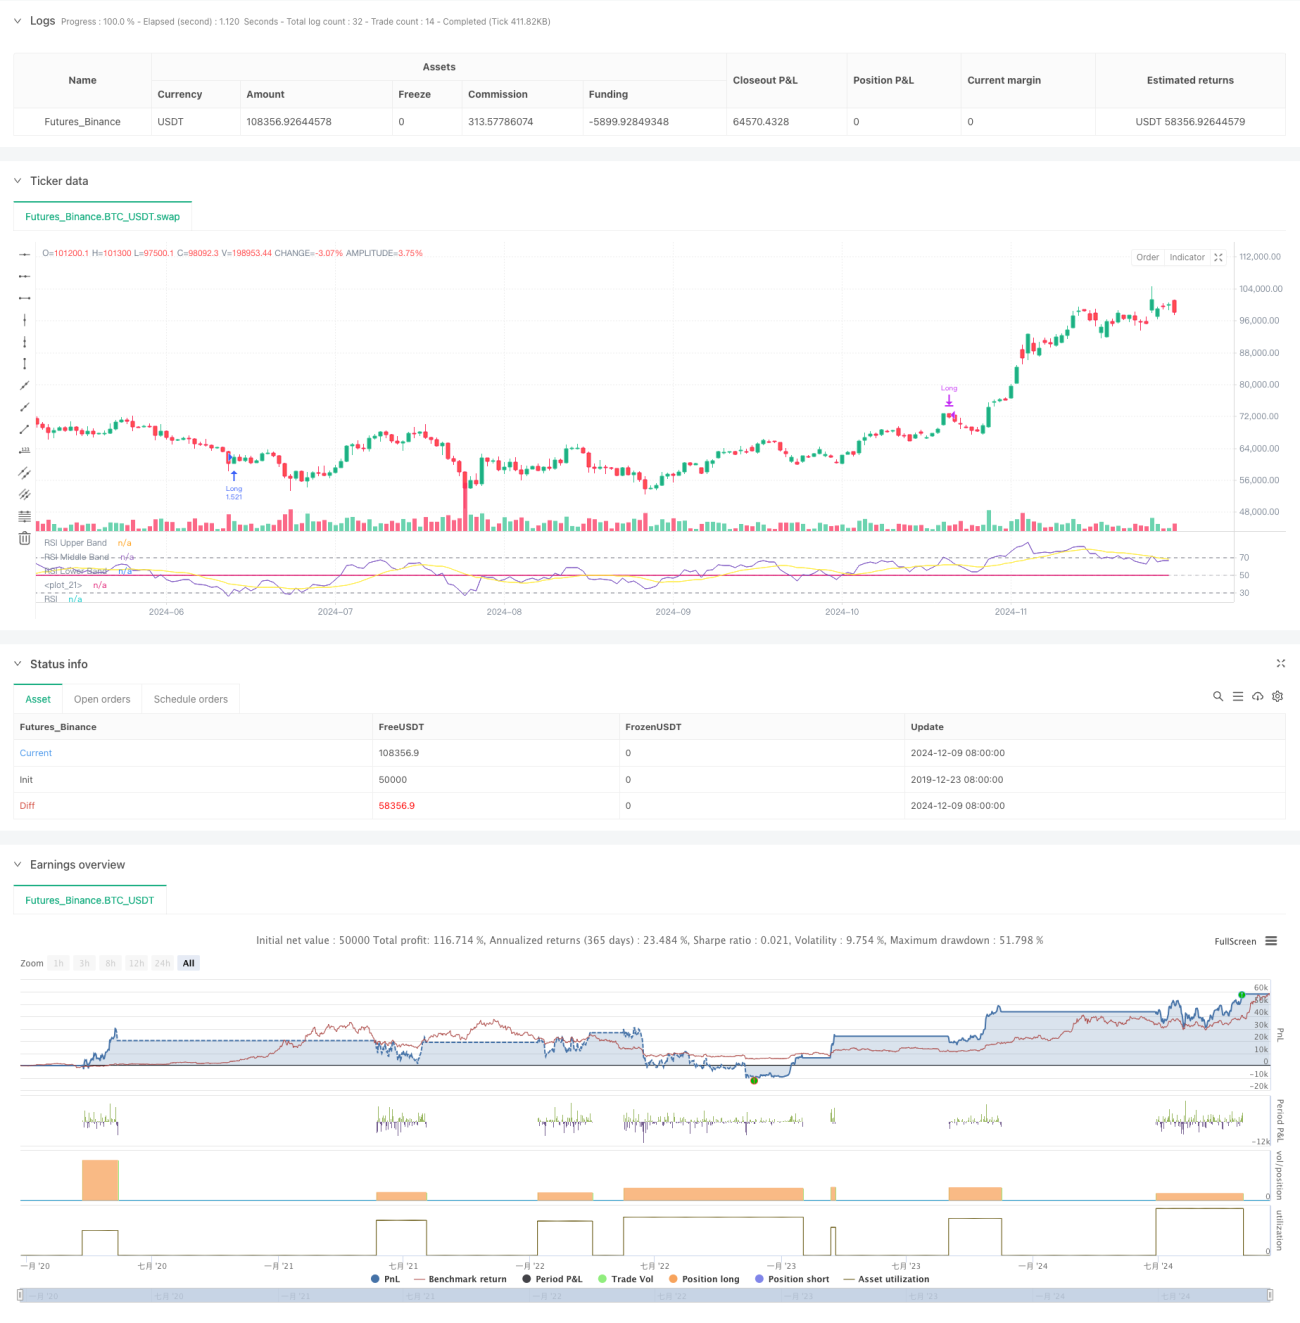
/*backtest
start: 2019-12-23 08:00:00
end: 2024-12-10 08:00:00
period: 1d
basePeriod: 1d
exchanges: [{"eid":"Futures_Binance","currency":"BTC_USDT"}]
*/

//@version=5
strategy(title="Demo GPT - Relative Strength Index", shorttitle="RSI Strategy", overlay=false, default_qty_type=strategy.percent_of_equity, default_qty_value=100, commission_value=0.1, slippage=3)

// Inputs- 1