Chiến lược giao dịch định lượng xu hướng thoái lui Fibonacci động nâng cao

Tổng quan
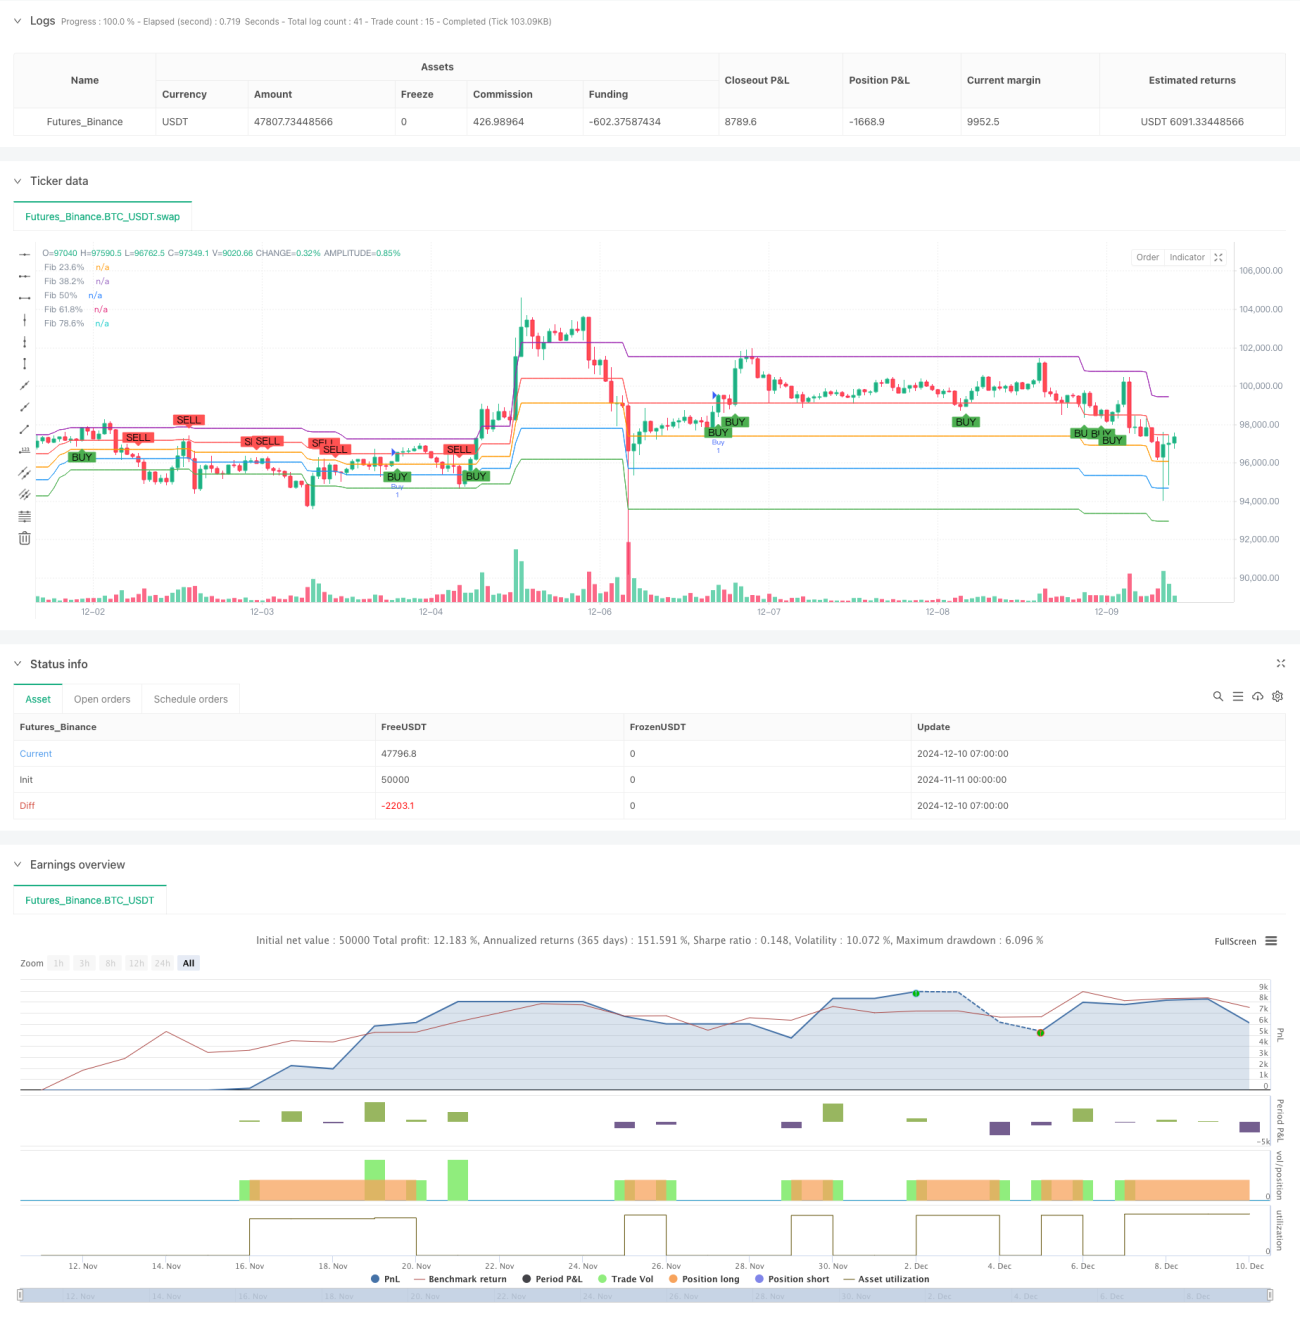
Chiến lược này là một hệ thống theo dõi xu hướng cao cấp dựa trên nguyên tắc Fibonacci Reversal. Nó xác định các vùng hỗ trợ và kháng cự tiềm năng bằng cách tính toán động các mức Fibonacci Reversal quan trọng: 23,6%, 38,2%, 50%, 61,8%, 78,6% . Hệ thống sử dụng cửa sổ quay ngược 100 chu kỳ để xác định điểm cao nhất và thấp nhất, và dựa trên đó tính toán các mức Reversal.
Nguyên tắc chiến lược
Lý luận cốt lõi của chiến lược được xây dựng trên lý thuyết rằng giá sẽ đảo ngược trong xu hướng chính gần mức rút lui Fibonacci quan trọng. Cụ thể:
- Hệ thống liên tục tính toán các điểm cao nhất và thấp nhất thông qua cửa sổ cuộn để đảm bảo cập nhật động mức độ rút lui
- Khi giá vượt qua mức rút lui 61.8% lên, nó sẽ kích hoạt nhiều tín hiệu cho thấy xu hướng tăng tiếp tục.
- Khi giá giảm xuống mức 38,2% thì hệ thống nhận ra đó là tín hiệu giảm giá.
- Stop loss được đặt ở mức 100% retraction (đặc biệt là điểm cao nhất) và Stop Loss được đặt ở mức 0% retraction (đặc biệt là điểm thấp nhất)
- Chiến lược sử dụng hàm plot để đánh dấu các cấp độ quan trọng trên biểu đồ để phân tích trực quan
Lợi thế chiến lược
- Tính linh hoạt - Chiến lược có thể tự động điều chỉnh mức thu hồi theo điều kiện thị trường
- Quản lý rủi ro hoàn hảo - Kiểm soát rủi ro chặt chẽ thông qua vị trí dừng lỗ trước
- Tín hiệu rõ ràng khách quan - tín hiệu vào và ra dựa trên sự phá vỡ giá khách quan, giảm phán đoán chủ quan
- Khả năng hiển thị cao - Hiển thị rõ ràng các mức giá quan trọng trên biểu đồ, giúp phân tích và xác minh dễ dàng
- Tính điều chỉnh tham số - chu kỳ hồi quy và trung bình nước Fibonacci có thể được điều chỉnh theo nhu cầu linh hoạt
Phân tích rủi ro
- Rủi ro thị trường chấn động - có thể tạo ra tín hiệu sai trong giai đoạn sắp xếp ngang
- Rủi ro bị tụt hậu - tính toán dựa trên dữ liệu lịch sử có thể gây ra sự tụt hậu tín hiệu
- Rủi ro nhảy vọt - Giá nhảy vọt có thể dẫn đến hiệu quả dừng lỗ
- Nhận thức tham số - các thiết lập chu kỳ hồi quy khác nhau sẽ ảnh hưởng đến hiệu suất của chiến lược
Các biện pháp để kiểm soát rủi ro là:
- Kết hợp các chỉ số xu hướng xác nhận môi trường thị trường
- Điều chỉnh đúng vị trí dừng lỗ
- Sử dụng phương pháp dừng lỗ di động
- Thường xuyên tối ưu hóa các tham số chính sách
Hướng tối ưu hóa chiến lược
- Thêm bộ lọc xu hướng, chỉ giao dịch trong xu hướng rõ ràng
- Ghi dấu xác nhận giao hàng
- Tối ưu hóa các cơ chế dừng lỗ, chẳng hạn như sử dụng dừng lỗ di động
- Tăng điều kiện lọc biến động thị trường
- Phát triển cơ chế điều chỉnh chu kỳ hồi quy thích ứng
Tóm tắt
Đây là một chiến lược giao dịch có hệ thống dựa trên lý thuyết phân tích kỹ thuật cổ điển. Bằng cách thực hiện theo chương trình, nó có tính khách quan và có thể lặp lại. Điểm mạnh cốt lõi của chiến lược là kết hợp lý thuyết Fibonacci với kiểm soát rủi ro nghiêm ngặt, phù hợp để sử dụng trong thị trường đang có xu hướng. Bằng cách tối ưu hóa và hoàn thiện liên tục, chiến lược này có thể duy trì hiệu suất ổn định trong nhiều môi trường thị trường.
- 1