Chiến lược giao dịch định lượng đảo ngược xu hướng của dải Bollinger nhiều giai đoạn

Tổng quan
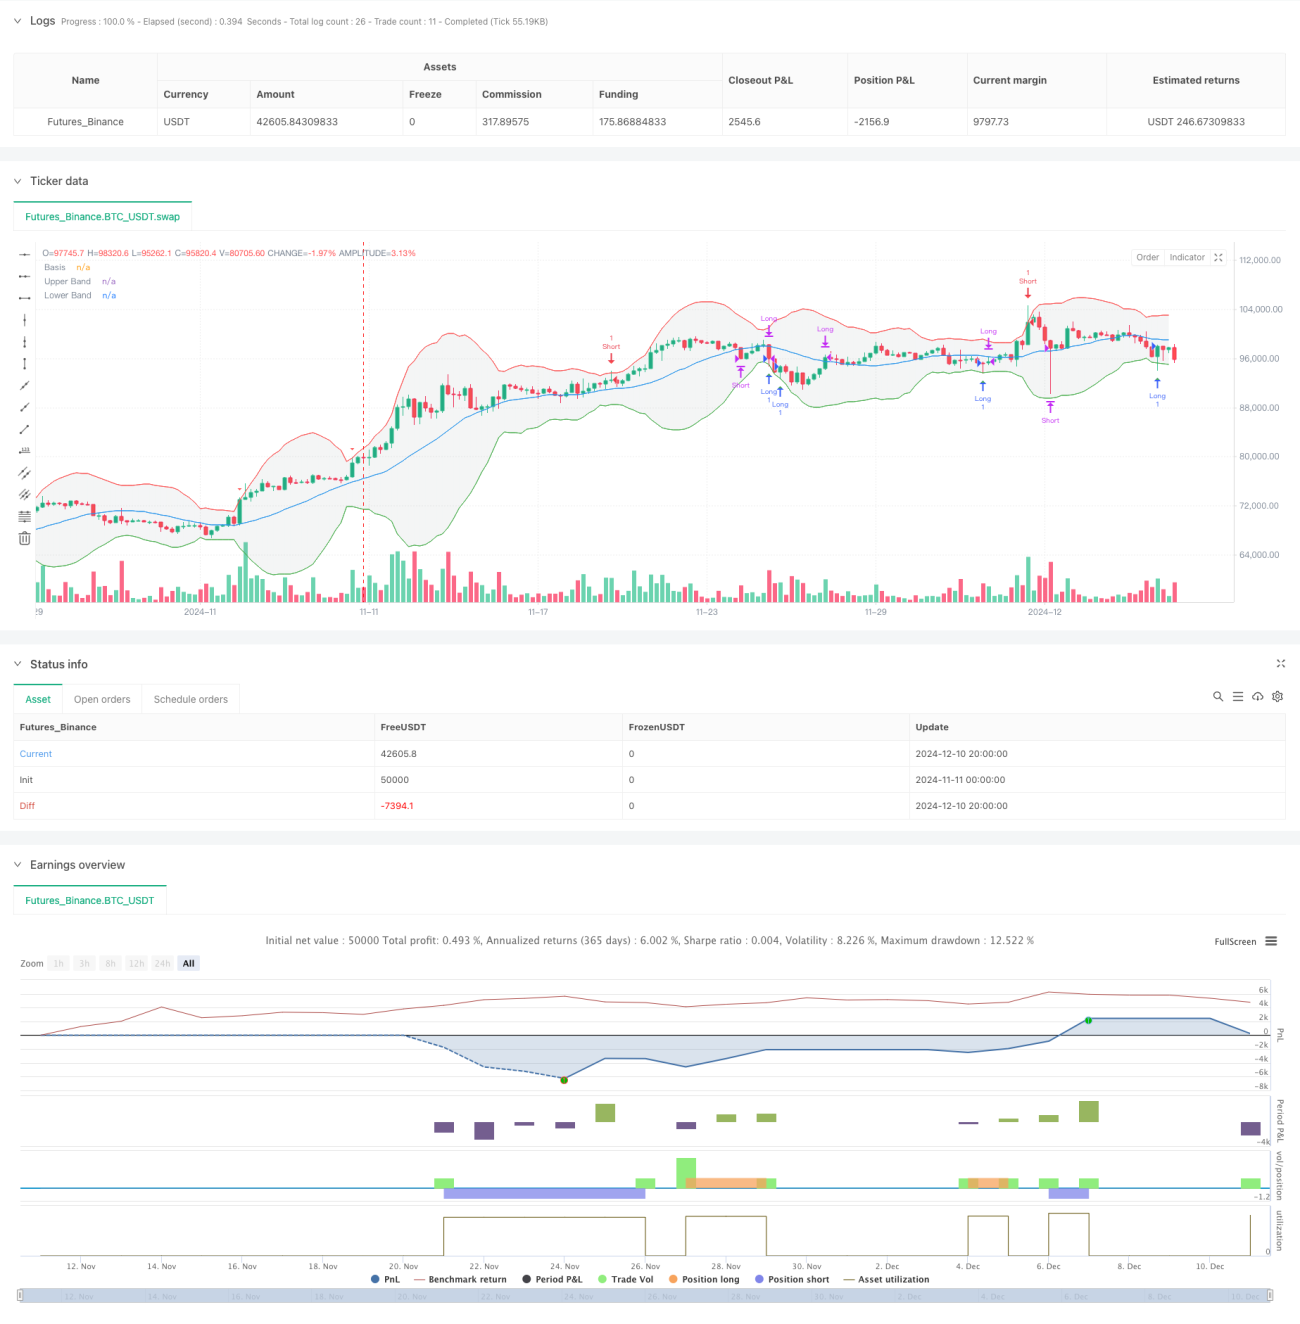
Chiến lược này là một hệ thống giao dịch đảo ngược xu hướng dựa trên các chỉ số Bollinger Bands để nắm bắt cơ hội đảo ngược thị trường bằng cách theo dõi mối quan hệ chạm của giá với Bollinger Bands. Chiến lược này hoạt động trên chu kỳ thời gian 5 phút, sử dụng đường trung bình di chuyển 20 chu kỳ làm đường trung tâm của Bollinger Bands và đặt chênh lệch tiêu chuẩn 3.4 lần làm tham số của Bollinger Bands.
Nguyên tắc chiến lược
Lý luận cốt lõi của chiến lược được xây dựng dựa trên lý thuyết quay trở về giá. Khi giá chạm vào đường dẫn của Brin, hệ thống cho rằng thị trường đã bán quá mức và có xu hướng làm nhiều hơn; Khi giá chạm vào đường dẫn của Brin, hệ thống cho rằng thị trường đã mua quá mức và có xu hướng làm rỗng. Cụ thể:
- Làm nhiều điều kiện: Khi giá thấp nhất của đường K 5 phút lần đầu tiên chạm hoặc phá vỡ đường ray xuống của dây Brin ((giờ giá thấp nhất của đường K <= đường ray và giá thấp nhất của đường K trước> đường ray xuống)
- Điều kiện làm trống: Khi giá cao nhất của đường K 5 phút lần đầu tiên chạm hoặc phá vỡ đường ray trên Burin (giờ giá cao nhất của đường K> = đường ray và giá cao nhất của đường K trước < đường ray)
- Điều kiện xuất phát: Giá quay trở lại mức bình quân tại đường trung tâm của vùng Brin
Lợi thế chiến lược
- Lựa chọn chỉ số hợp lý: Binance tích hợp thông tin về xu hướng và biến động để xác định hiệu quả tình trạng thị trường
- Đúng thời gian vào sân: Brin bắt được tín hiệu quay ngược bằng cách chạm vào lần đầu tiên, tránh bị ngã
- Logic điều khiển gió hoàn hảo: Sử dụng moving average làm chuẩn ngăn chặn, bảo vệ lợi nhuận và không rời khỏi sân quá sớm
- Các tham số cấu hình khoa học: Thiết lập kém tiêu chuẩn 3.4 lần có thể lọc hiệu quả các tín hiệu giả
- Cấu trúc hệ thống rõ ràng: logic giao dịch đơn giản, trực quan, dễ bảo trì và tối ưu hóa
Rủi ro chiến lược
- Rủi ro phá vỡ xu hướng: Trong thị trường có xu hướng mạnh, giá có thể tiếp tục phá vỡ vùng Brin dẫn đến tổn thất thường xuyên
- Rủi ro thị trường chấn động: Thời gian chấn động có thể tạo ra quá nhiều tín hiệu giả làm tăng chi phí giao dịch
- Tính nhạy cảm của các tham số: những thay đổi nhỏ trong tham số Brin có thể có ảnh hưởng lớn đến hiệu suất của chiến lược
- Tác động của điểm trượt: Trong môi trường có biến động cao, có thể gặp phải điểm trượt nghiêm trọng dẫn đến suy giảm hiệu suất chiến lược
- Dựa vào chu kỳ thời gian: có thể có sự khác biệt đáng kể trong hiệu suất của chiến lược trong các chu kỳ thời gian khác nhau
Hướng tối ưu hóa chiến lược
- Nhiều chu kỳ thời gian: giới thiệu xác nhận băng thông Brin với chu kỳ dài hơn, tăng độ tin cậy tín hiệu
- Trình lọc xu hướng: Tăng các chỉ số đánh giá xu hướng, chỉ mở đầu tư khi xu hướng rõ ràng
- Tham số động: điều chỉnh tham số Brin theo biến động của thị trường
- Tối ưu hóa dừng lỗ: Thiết lập theo dõi dừng lỗ hoặc dừng dựa trên ATR để cải thiện hiệu quả kiểm soát gió
- Quản lý vị trí: tỷ lệ giữ vị trí được điều chỉnh theo cường độ tín hiệu và biến động của thị trường
Tóm tắt
Chiến lược này nắm bắt cơ hội đảo ngược thị trường bằng cách chạm vào dây chuyền Brin, có tính năng rõ ràng về logic, kiểm soát rủi ro hợp lý. Với thiết lập tham số hợp lý và quy tắc giao dịch hoàn hảo, chiến lược thể hiện sự ổn định tốt trong thị trường biến động. Tuy nhiên, khi áp dụng trên sàn giao dịch, vẫn cần chú ý đến nguy cơ phá vỡ xu hướng, khuyến nghị xác nhận giao dịch kết hợp với các chỉ số kỹ thuật khác và điều chỉnh tham số chiến lược theo động thái của tình trạng thị trường.
- 1