Chiến lược theo xu hướng đa chỉ báo kết hợp với kênh động và hệ thống giao dịch trung bình động

Tổng quan
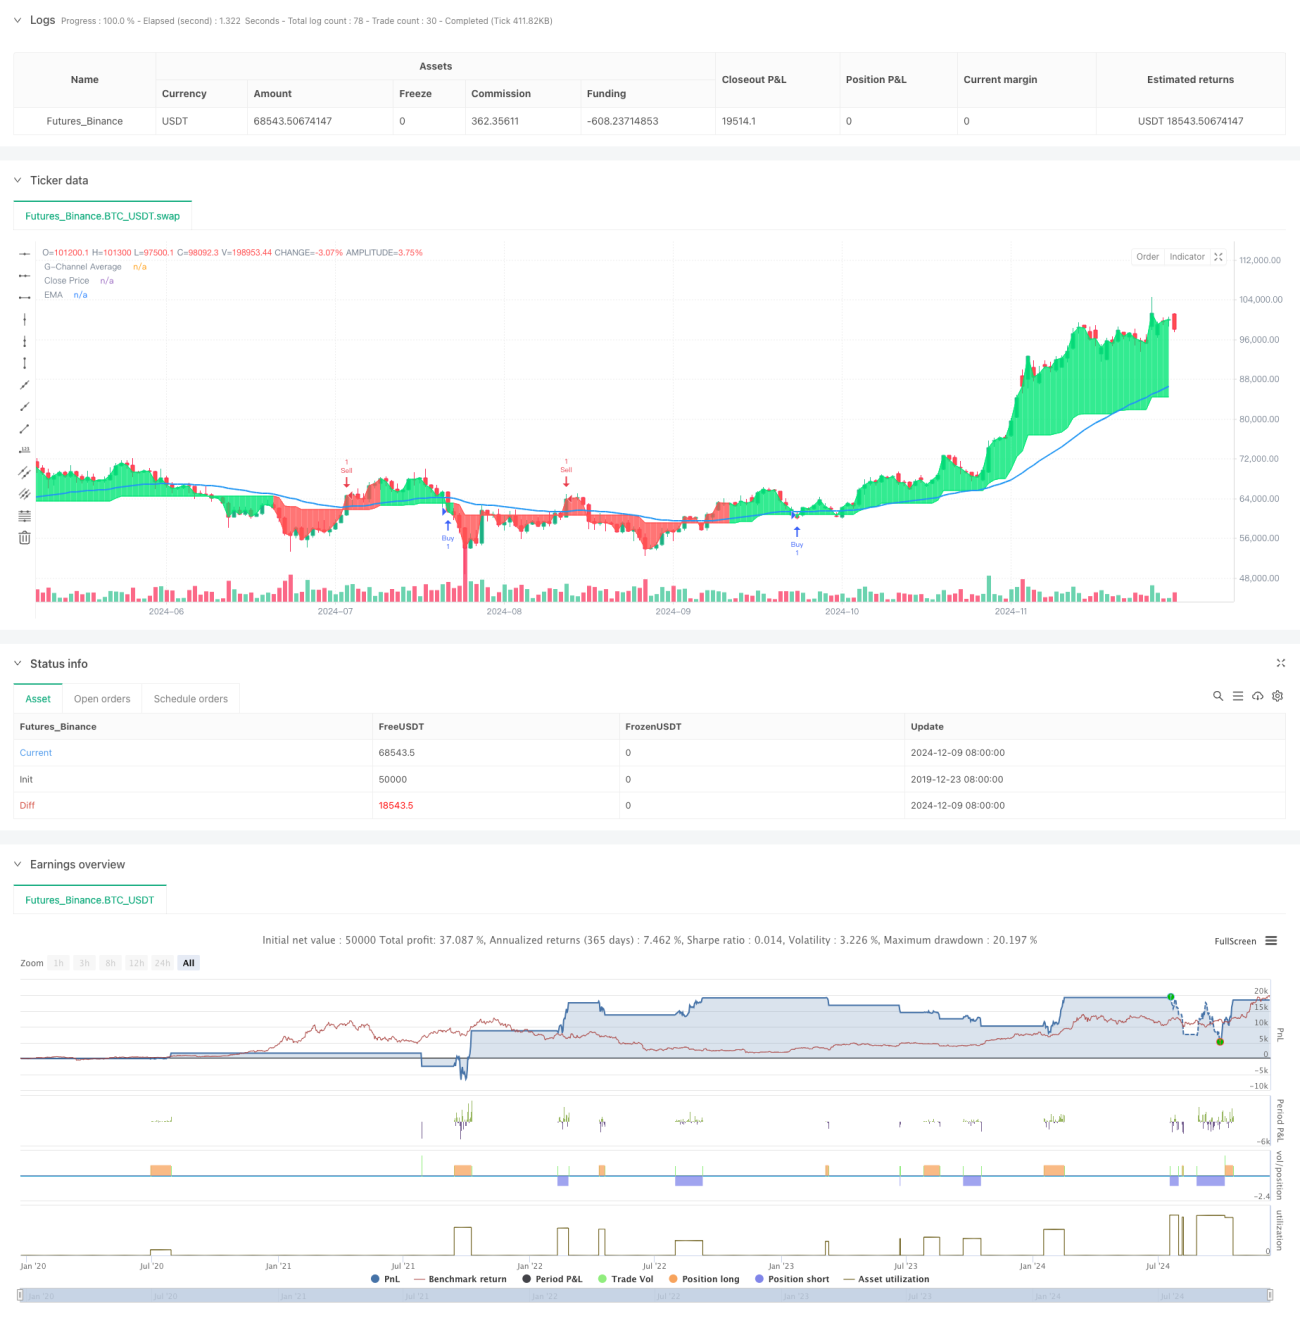
Chiến lược này là một hệ thống giao dịch đa chỉ số kết hợp các kênh G, đường trung bình di chuyển chỉ số (EMA) và độ dao động thực sự (ATR). Nó xác định tín hiệu giao dịch thông qua hỗ trợ / kháng cự động và xác nhận xu hướng và quản lý rủi ro bằng cách sử dụng các điểm dừng và dừng dựa trên ATR. Hệ thống được thiết kế tập trung vào độ tin cậy và kiểm soát rủi ro, phù hợp cho các nhà giao dịch tìm kiếm phương pháp giao dịch vững chắc.
Nguyên tắc chiến lược
Lập luận cốt lõi của chiến lược dựa trên một số thành phần quan trọng sau:
- G channel tính toán hỗ trợ động và mức kháng cự, liên tục điều chỉnh lên và xuống đường ray thông qua các công thức toán học
- EMA được sử dụng để xác định hướng của xu hướng tổng thể, vị trí của giá so với EMA quyết định hướng giao dịch
- Tín hiệu nhập dựa trên đột phá của kênh G và xác nhận vị trí của EMA
- Thiết lập dừng và dừng với ATR nhân, dừng là 2 lần ATR, dừng là 4 lần ATR
- Tránh lặp đi lặp lại thông qua theo dõi trạng thái
Lợi thế chiến lược
- Cơ chế xác nhận tín hiệu đa tầng giúp tăng độ tin cậy giao dịch
- Biên giới kênh được điều chỉnh động để thích ứng với các môi trường thị trường khác nhau
- Quản lý rủi ro dựa trên tỷ lệ biến động thích ứng hơn
- Tránh các tín hiệu lặp lại để giảm nguy cơ giao dịch quá mức
- Dấu hiệu mua bán rõ ràng cho phép phân tích và phản hồi
Rủi ro chiến lược
- Có thể có quá nhiều tín hiệu phá vỡ giả trên thị trường giao dịch ngang
- EMA là một chỉ số chậm trễ có thể gây ra sự chậm trễ trong thời gian nhập cảnh
- ATR dừng với số nhân cố định có thể không linh hoạt trong thời gian biến động cao
- Các chỉ số cần dữ liệu lịch sử lâu hơn
- Tối ưu hóa tham số có thể dẫn đến quá khớp
Hướng tối ưu hóa chiến lược
- Nhập tín hiệu xác nhận giao thông, tăng độ tin cậy của đột phá
- Hoạt động điều chỉnh hệ số ATR để thích ứng với các tình trạng biến động thị trường khác nhau
- Thêm bộ lọc môi trường thị trường để tránh giao dịch trong điều kiện bất lợi
- Tối ưu hóa logic lọc tín hiệu, giảm thêm tín hiệu giả
- Xem xét thêm hệ thống quản lý vị trí động
Tóm tắt
Chiến lược này xây dựng một hệ thống giao dịch hoàn chỉnh bằng cách kết hợp nhiều chỉ số kỹ thuật đã được chứng minh. Điểm mạnh của hệ thống là cơ chế xác nhận tín hiệu nhiều cấp và quản lý rủi ro dựa trên tỷ lệ biến động, nhưng vẫn cần được tối ưu hóa theo đặc điểm thị trường cụ thể trong ứng dụng thực tế.
- 1