Chiến lược theo dõi biến động động theo xu hướng đa kỳ

EMA RSI MACD ATR
Ngày tạo: 2024-12-12 16:24:49 sửa đổi lần cuối: 2024-12-12 16:24:49
sao chép: 1 Số nhấp chuột: 423
1
tập trung vào
1617
Người theo dõi

Chiến lược theo dõi biến động động theo xu hướng đa kỳ

Tổng quan

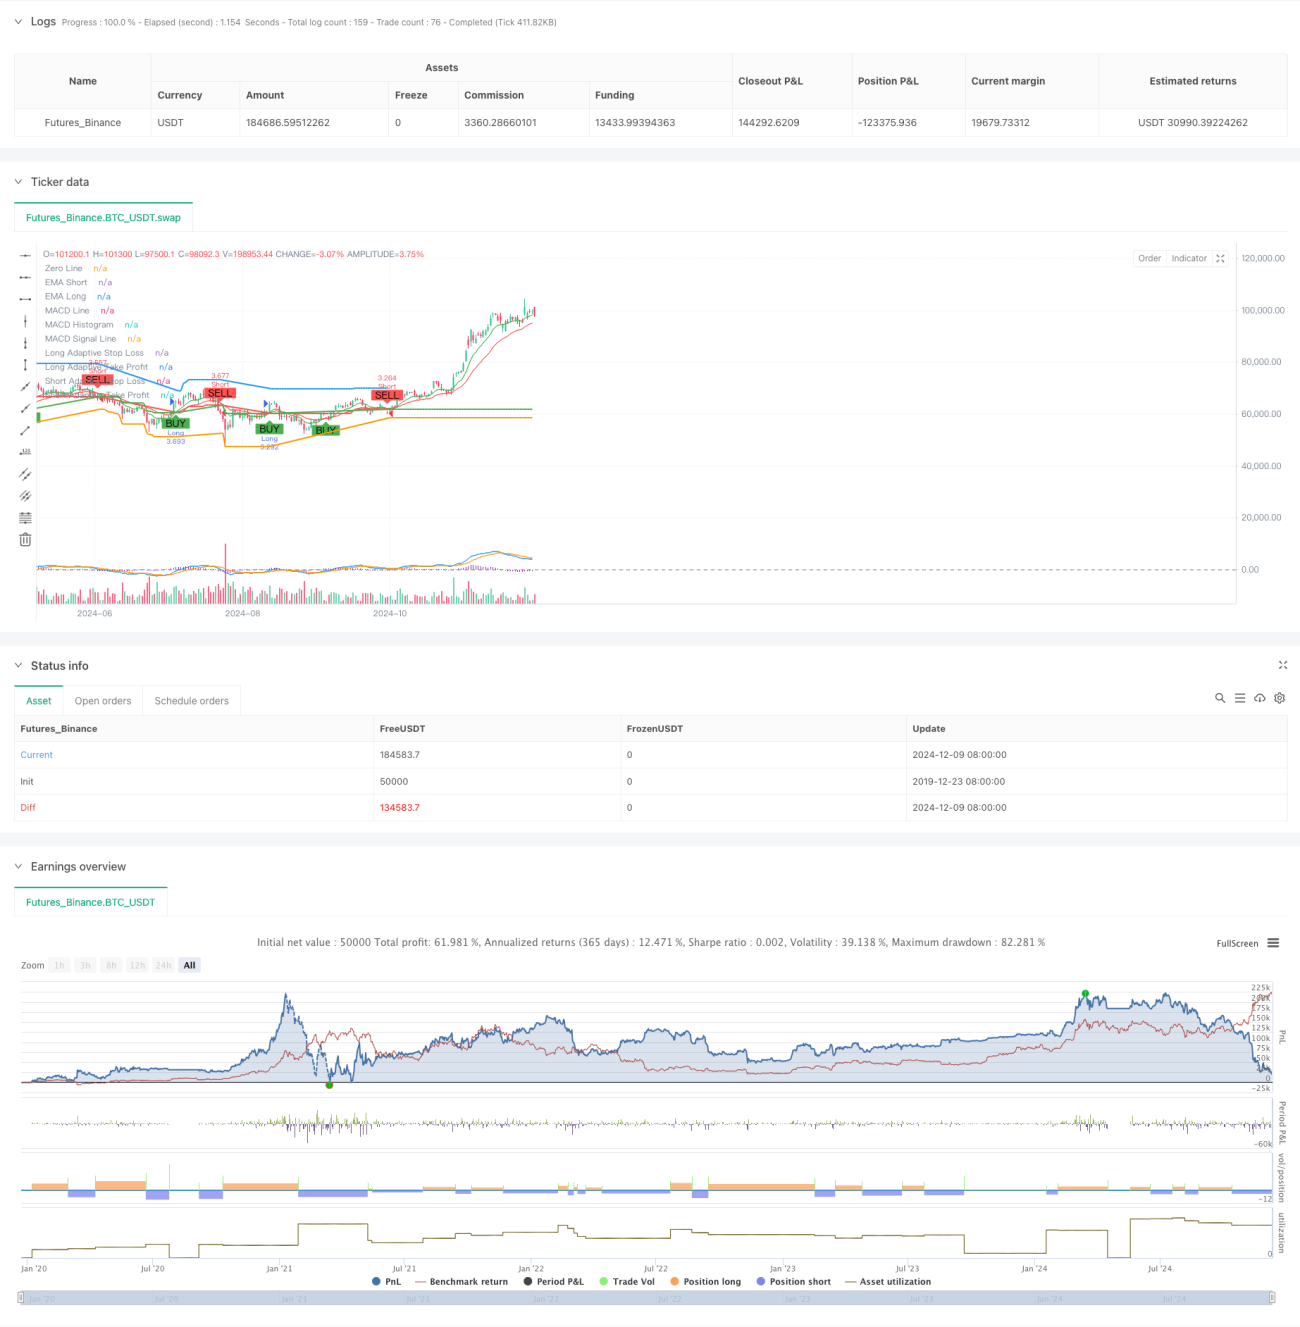
Chiến lược này là một hệ thống theo dõi xu hướng tự điều chỉnh kết hợp nhiều chỉ số kỹ thuật. Nó tối ưu hóa hiệu suất giao dịch thông qua phân tích nhiều chu kỳ và điều chỉnh động điểm dừng lỗ.

Nguyên tắc chiến lược

Chiến lược sử dụng cơ chế xác minh ba lần để giao dịch: 1) Xác định xu hướng xu hướng thông qua EMA thời gian nhanh và chậm; 2) Sử dụng RSI để xác nhận mức mua bán và MACD xu hướng để lọc tín hiệu giao dịch; 3) Tiếp cận EMA thời gian cao hơn để xác nhận xu hướng. Về mặt kiểm soát rủi ro, chiến lược điều chỉnh mục tiêu dừng lỗ và lợi nhuận theo động thái ATR, thực hiện quản lý vị trí thích ứng.

Lợi thế chiến lược

  1. Cơ chế xác thực tín hiệu đa chiều giúp tăng độ chính xác của giao dịch
  2. Cài đặt dừng lỗ thích ứng có thể thích ứng tốt hơn với các môi trường thị trường khác nhau
  3. Sự xác nhận xu hướng thời gian cao hơn có hiệu quả trong việc giảm nguy cơ đột phá giả
  4. Hệ thống cảnh báo tốt giúp nắm bắt cơ hội giao dịch kịp thời và kiểm soát rủi ro
  5. Cài đặt hướng giao dịch linh hoạt cho phép chiến lược thích nghi với sở thích giao dịch khác nhau

Rủi ro chiến lược

  1. Cơ chế xác thực đa dạng có thể khiến bạn bỏ lỡ cơ hội nhanh chóng
  2. Trong một thị trường biến động mạnh, các lệnh dừng động có thể được kích hoạt quá sớm
  3. Các tín hiệu sai có thể xảy ra thường xuyên trong thị trường phân tích ngang
  4. Có thể có nguy cơ quá phù hợp trong quá trình tối ưu hóa tham số
  5. Phân tích đa chu kỳ có thể xuất hiện các tín hiệu mâu thuẫn trong các chu kỳ thời gian khác nhau

Hướng tối ưu hóa chiến lược

  1. Tiếp tục giới thiệu các chỉ số giao thông để hỗ trợ xác nhận và tăng độ tin cậy tín hiệu
  2. Hệ thống đánh giá định lượng tăng cường độ xu hướng, tối ưu hóa thời gian nhập cảnh
  3. Phát triển cơ chế tối ưu hóa tham số thích ứng, nâng cao tính ổn định của chiến lược
  4. Tham gia hệ thống phân loại môi trường thị trường, sử dụng các tham số khác nhau cho các thị trường khác nhau
  5. Phát triển hệ thống quản lý vị thế động, điều chỉnh số lượng nắm giữ theo cường độ tín hiệu

Tóm tắt

Đây là một hệ thống theo dõi xu hướng được thiết kế nghiêm ngặt, cung cấp một giải pháp giao dịch toàn diện thông qua cơ chế xác minh nhiều cấp và quản lý rủi ro động. Điểm mạnh cốt lõi của chiến lược là khả năng thích ứng và kiểm soát rủi ro của nó, nhưng khi sử dụng, cần chú ý đến việc tối ưu hóa tham số và phù hợp với môi trường thị trường.

Mã nguồn chiến lược
/*backtest
start: 2019-12-23 08:00:00
end: 2024-12-10 08:00:00
period: 1d
basePeriod: 1d
exchanges: [{"eid":"Futures_Binance","currency":"BTC_USDT"}]
*/

//@version=5
strategy("TrenGuard Adaptive ATR Strategy", overlay=true, default_qty_type=strategy.percent_of_equity, default_qty_value=100)

// Parameters
emaShortPeriod = input.int(9, title="Short EMA Period", minval=1)
emaLongPeriod = input.int(21, title="Long EMA Period", minval=1)
rsiPeriod = input.int(14, title="RSI Period", minval=1)
rsiOverbought = input.int(70, title="RSI Overbought", minval=50)
rsiOversold = input.int(30, title="RSI Oversold", minval=1)
atrPeriod = input.int(14, title="ATR Period", minval=1)
atrMultiplierSL = input.float(2.0, title="ATR Multiplier for Stop-Loss", minval=0.1)
atrMultiplierTP = input.float(2.0, title="ATR Multiplier for Take-Profit", minval=0.1)

// Multi-timeframe settings
htfEMAEnabled = input.bool(true, title="Use Higher Timeframe EMA Confirmation?", inline="htf")
htfEMATimeframe = input.timeframe("D", title="Higher Timeframe", inline="htf")

// MACD Parameters
macdShortPeriod = input.int(12, title="MACD Short Period", minval=1)
macdLongPeriod = input.int(26, title="MACD Long Period", minval=1)
macdSignalPeriod = input.int(9, title="MACD Signal Period", minval=1)

// Select trade direction
tradeDirection = input.string("Both", title="Trade Direction", options=["Both", "Long", "Short"])

// Calculating indicators
emaShort = ta.ema(close, emaShortPeriod)
emaLong = ta.ema(close, emaLongPeriod)
rsiValue = ta.rsi(close, rsiPeriod)
atrValue = ta.atr(atrPeriod)
[macdLine, macdSignalLine, _] = ta.macd(close, macdShortPeriod, macdLongPeriod, macdSignalPeriod)

// Higher timeframe EMA confirmation
htfEMALong = request.security(syminfo.tickerid, htfEMATimeframe, ta.ema(close, emaLongPeriod))

// Trading conditions
longCondition = ta.crossover(emaShort, emaLong) and rsiValue < rsiOverbought and (not htfEMAEnabled or close > htfEMALong) and macdLine > macdSignalLine
shortCondition = ta.crossunder(emaShort, emaLong) and rsiValue > rsiOversold and (not htfEMAEnabled or close < htfEMALong) and macdLine < macdSignalLine

// Initial Stop-Loss and Take-Profit levels based on ATR
var float adaptiveStopLoss = na
var float adaptiveTakeProfit = na

if (strategy.position_size > 0) // Long Position
    if (longCondition) // Trend Confirmation
        adaptiveStopLoss := na(adaptiveStopLoss) ? close - atrValue * atrMultiplierSL : math.max(adaptiveStopLoss, close - atrValue * atrMultiplierSL)
        adaptiveTakeProfit := na(adaptiveTakeProfit) ? close + atrValue * atrMultiplierTP : math.max(adaptiveTakeProfit, close + atrValue * atrMultiplierTP)
    else
        adaptiveStopLoss := na(adaptiveStopLoss) ? close - atrValue * atrMultiplierSL : math.max(adaptiveStopLoss, close - atrValue * atrMultiplierSL)
        adaptiveTakeProfit := na(adaptiveTakeProfit) ? close + atrValue * atrMultiplierTP : math.max(adaptiveTakeProfit, close + atrValue * atrMultiplierTP)

if (strategy.position_size < 0) // Short Position
    if (shortCondition) // Trend Confirmation
        adaptiveStopLoss := na(adaptiveStopLoss) ? close + atrValue * atrMultiplierSL : math.min(adaptiveStopLoss, close + atrValue * atrMultiplierSL)
        adaptiveTakeProfit := na(adaptiveTakeProfit) ? close - atrValue * atrMultiplierTP : math.min(adaptiveTakeProfit, close - atrValue * atrMultiplierTP)
    else
        adaptiveStopLoss := na(adaptiveStopLoss) ? close + atrValue * atrMultiplierSL : math.min(adaptiveStopLoss, close + atrValue * atrMultiplierSL)
        adaptiveTakeProfit := na(adaptiveTakeProfit) ? close - atrValue * atrMultiplierTP : math.min(adaptiveTakeProfit, close - atrValue * atrMultiplierTP)

// Strategy Entry
if (longCondition and (tradeDirection == "Both" or tradeDirection == "Long"))
    strategy.entry("Long", strategy.long)
    
if (shortCondition and (tradeDirection == "Both" or tradeDirection == "Short"))
    strategy.entry("Short", strategy.short)

// Strategy Exit
if (strategy.position_size > 0) // Long Position
    strategy.exit("Exit Long", "Long", stop=adaptiveStopLoss, limit=adaptiveTakeProfit, when=shortCondition)

if (strategy.position_size < 0) // Short Position
    strategy.exit("Exit Short", "Short", stop=adaptiveStopLoss, limit=adaptiveTakeProfit, when=longCondition)

// Plotting EMAs
plot(emaShort, title="EMA Short", color=color.green)
plot(emaLong, title="EMA Long", color=color.red)

// Plotting MACD
hline(0, "Zero Line", color=color.gray)
plot(macdLine - macdSignalLine, title="MACD Histogram", color=color.purple, style=plot.style_histogram)
plot(macdLine, title="MACD Line", color=color.blue)
plot(macdSignalLine, title="MACD Signal Line", color=color.orange)

// Plotting Buy/Sell signals with distinct colors
plotshape(series=longCondition, title="Buy Signal", location=location.belowbar, color=color.green, style=shape.labelup, text="BUY")
plotshape(series=shortCondition, title="Sell Signal", location=location.abovebar, color=color.red, style=shape.labeldown, text="SELL")

// Plotting Trailing Stop-Loss and Take-Profit levels with distinct colors
plot(strategy.position_size > 0 ? adaptiveStopLoss : na, title="Long Adaptive Stop Loss", color=color.red, linewidth=2, style=plot.style_line)
plot(strategy.position_size < 0 ? adaptiveStopLoss : na, title="Short Adaptive Stop Loss", color=color.green, linewidth=2, style=plot.style_line)
plot(strategy.position_size > 0 ? adaptiveTakeProfit : na, title="Long Adaptive Take Profit", color=color.blue, linewidth=2, style=plot.style_line)
plot(strategy.position_size < 0 ? adaptiveTakeProfit : na, title="Short Adaptive Take Profit", color=color.orange, linewidth=2, style=plot.style_line)

// Alert conditions for entry signals
alertcondition(longCondition and (tradeDirection == "Both" or tradeDirection == "Long"), title="Long Signal", message="Long signal triggered: BUY")
alertcondition(shortCondition and (tradeDirection == "Both" or tradeDirection == "Short"), title="Short Signal", message="Short signal triggered: SELL")

// Alert conditions for exit signals
alertcondition(strategy.position_size > 0 and shortCondition, title="Exit Long Signal", message="Exit long position: SELL")
alertcondition(strategy.position_size < 0 and longCondition, title="Exit Short Signal", message="Exit short position: BUY")

// Alert conditions for reaching take-profit levels
alertcondition(strategy.position_size > 0 and close >= adaptiveTakeProfit, title="Take Profit Long Signal", message="Take profit level reached for long position")
alertcondition(strategy.position_size < 0 and close <= adaptiveTakeProfit, title="Take Profit Short Signal", message="Take profit level reached for short position")