Chiến lược trung bình hóa chi phí đô la của dải Bollinger Band

BB DCA EMA SMA
Ngày tạo: 2024-12-12 17:17:15 sửa đổi lần cuối: 2024-12-12 17:17:15
sao chép: 2 Số nhấp chuột: 447
1
tập trung vào
1617
Người theo dõi

Chiến lược trung bình hóa chi phí đô la của dải Bollinger Band

Tổng quan

Chiến lược này là một chiến lược đầu tư thông minh kết hợp các chỉ số kỹ thuật DCA và BRI. Nó được thực hiện bằng cách tích trữ một cách có hệ thống trong thời gian giá giảm và sử dụng nguyên tắc hồi phục giá trị trung bình.

Nguyên tắc chiến lược

Các nguyên tắc cốt lõi của chiến lược được xây dựng trên ba nền tảng: 1) phương pháp chi phí trung bình đô la, giảm rủi ro khi chọn lựa bằng cách đầu tư một khoản tiền cố định định kỳ; 2) lý thuyết quay trở lại giá trị trung bình, cho rằng giá cuối cùng sẽ quay trở lại mức trung bình lịch sử của nó; 3) chỉ số Bollinger Bands, được sử dụng để xác định khu vực mua quá mức.

Lợi thế chiến lược

  1. Giảm rủi ro khi lựa chọn - Giảm sai lầm của con người bằng cách mua một cách có hệ thống thay vì phán đoán chủ quan
  2. Tận dụng cơ hội điều chỉnh lại - tự động thực hiện giao dịch mua khi giá vượt quá mức giảm
  3. Cài đặt tham số linh hoạt - có thể điều chỉnh tham số và số tiền đầu tư của Brinh Băng theo các điều kiện thị trường khác nhau
  4. Quy tắc nhập cảnh và xuất cảnh rõ ràng - tín hiệu khách quan dựa trên các chỉ số kỹ thuật
  5. Thực hiện tự động - không cần sự can thiệp của con người, tránh giao dịch cảm xúc

Rủi ro chiến lược

  1. Rủi ro thất bại của giá trị trung bình - có thể tạo ra nhiều tín hiệu sai trong thị trường xu hướng
  2. Quản lý rủi ro tài chính - Cần phải có đủ tiền để đối phó với tín hiệu mua liên tục
  3. Rủi ro tối ưu hóa tham số - tối ưu hóa quá mức có thể dẫn đến thất bại của chiến lược
  4. Tùy thuộc vào môi trường thị trường - có thể không hoạt động tốt trong thị trường biến động mạnh Những rủi ro này được quản lý bằng cách áp dụng hệ thống quản lý tài chính nghiêm ngặt và đánh giá thường xuyên hiệu suất chiến lược.

Hướng tối ưu hóa chiến lược

  1. Tiếp theo, bạn có thể sử dụng một bộ lọc xu hướng để tránh hoạt động ngược trong một xu hướng mạnh.
  2. Thêm cơ chế xác nhận nhiều chu kỳ thời gian
  3. Tối ưu hóa hệ thống quản lý vốn, điều chỉnh số tiền đầu tư theo biến động của tỷ lệ biến động
  4. Tham gia vào cơ chế kết thúc lợi nhuận, kết thúc lợi nhuận khi giá quay trở lại trung bình
  5. Xem xét kết hợp với các chỉ số kỹ thuật khác để tăng độ tin cậy tín hiệu

Tóm tắt

Đây là một chiến lược vững chắc kết hợp phân tích kỹ thuật với phương pháp đầu tư có hệ thống. Nhận ra cơ hội vượt quá giá trị của Brin, kết hợp với phương pháp chi phí trung bình đô la để giảm rủi ro. Chìa khóa thành công của chiến lược là thiết lập hợp lý các tham số và kỷ luật thực hiện nghiêm ngặt.
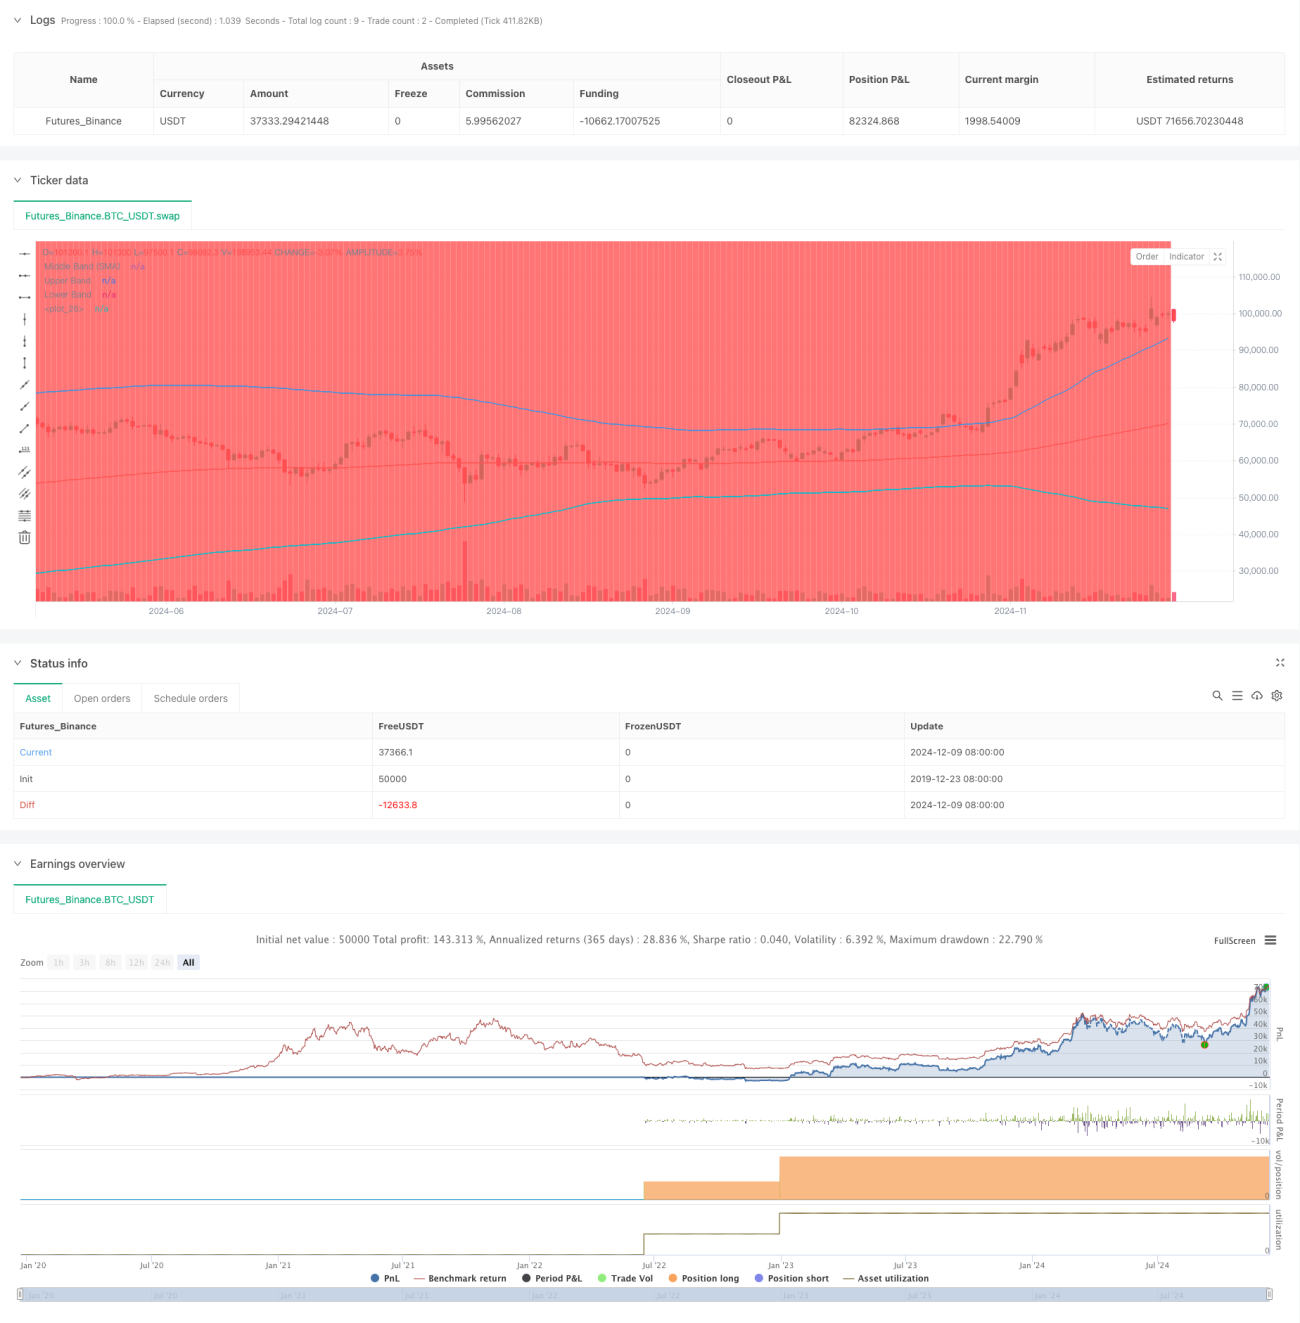
Mã nguồn chiến lược
/*backtest
start: 2019-12-23 08:00:00
end: 2024-12-10 08:00:00
period: 1d
basePeriod: 1d
exchanges: [{"eid":"Futures_Binance","currency":"BTC_USDT"}]
*/

//@version=5
strategy("DCA Strategy with Mean Reversion and Bollinger Band", overlay=true) // Define the strategy name and set overlay=true to display on the main chart

// Inputs for investment amount and dates
investment_amount = input.float(10000, title="Investment Amount (USD)", tooltip="Amount to be invested in each buy order (in USD)") // Amount to invest in each buy order
open_date = input(timestamp("2024-01-01 00:00:00"), title="Open All Positions On", tooltip="Date when to start opening positions for DCA strategy") // Date to start opening positions
close_date = input(timestamp("2024-08-04 00:00:00"), title="Close All Positions On", tooltip="Date when to close all open positions for DCA strategy") // Date to close all positions

// Bollinger Band parameters
source = input.source(title="Source", defval=close, group="Bollinger Band Parameter", tooltip="The price source to calculate the Bollinger Bands (e.g., closing price)") // Source of price for calculating Bollinger Bands (e.g., closing price)
length = input.int(200, minval=1, title='Period', group="Bollinger Band Parameter", tooltip="Period for the Bollinger Band calculation (e.g., 200-period moving average)") // Period for calculating the Bollinger Bands (e.g., 200-period moving average)
mult = input.float(2, minval=0.1, maxval=50, step=0.1, title='Standard Deviation', group="Bollinger Band Parameter", tooltip="Multiplier for the standard deviation to define the upper and lower bands") // Multiplier for the standard deviation to calculate the upper and lower bands

// Timeframe selection for Bollinger Bands
tf = input.timeframe(title="Bollinger Band Timeframe", defval="240", group="Bollinger Band Parameter", tooltip="The timeframe used to calculate the Bollinger Bands (e.g., 4-hour chart)") // Timeframe for calculating the Bollinger Bands (e.g., 4-hour chart)

// Calculate BB for the chosen timeframe using security
[basis, bb_dev] = request.security(syminfo.tickerid, tf, [ta.ema(source, length), mult * ta.stdev(source, length)]) // Calculate Basis (EMA) and standard deviation for the chosen timeframe
upper = basis + bb_dev // Calculate the Upper Band by adding the standard deviation to the Basis
lower = basis - bb_dev // Calculate the Lower Band by subtracting the standard deviation from the Basis

// Plot Bollinger Bands
plot(basis, color=color.red, title="Middle Band (SMA)") // Plot the middle band (Basis, EMA) in red
plot(upper, color=color.blue, title="Upper Band") // Plot the Upper Band in blue
plot(lower, color=color.blue, title="Lower Band") // Plot the Lower Band in blue
fill(plot(upper), plot(lower), color=color.blue, transp=90) // Fill the area between Upper and Lower Bands with blue color at 90% transparency

// Define buy condition based on Bollinger Band 
buy_condition = ta.crossunder(source, lower) // Define the buy condition when the price crosses under the Lower Band (Mean Reversion strategy)

// Execute buy orders on the Bollinger Band Mean Reversion condition
if (buy_condition ) // Check if the buy condition is true and time is within the open and close date range
    strategy.order("DCA Buy", strategy.long, qty=investment_amount / close) // Execute the buy order with the specified investment amount

// Close all positions on the specified date
if (time >= close_date) // Check if the current time is after the close date
    strategy.close_all() // Close all open positions

// Track the background color state
var color bgColor = na // Initialize a variable to store the background color (set to 'na' initially)

// Update background color based on conditions
if close > upper // If the close price is above the Upper Band
    bgColor := color.red // Set the background color to red
else if close < lower // If the close price is below the Lower Band
    bgColor := color.green // Set the background color to green

// Apply the background color
bgcolor(bgColor, transp=90, title="Background Color Based on Bollinger Bands") // Set the background color based on the determined condition with 90% transparency

// Postscript:
// 1. Once you have set the "Investment Amount (USD)" in the input box, proceed with additional configuration. 
// Go to "Properties" and adjust the "Initial Capital" value by calculating it as "Total Closed Trades" multiplied by "Investment Amount (USD)" 
// to ensure the backtest results are aligned correctly with the actual investment values.
//
// Example:
// Investment Amount (USD) = 100 USD
// Total Closed Trades = 10 
// Initial Capital = 10 x 100 = 1,000 USD

// Investment Amount (USD) = 200 USD
// Total Closed Trades = 24 
// Initial Capital = 24 x 200 = 4,800 USD