Chiến lược theo xu hướng ATR động dựa trên đột phá mức hỗ trợ

1
Follow
1781
Followers
Tổng quan
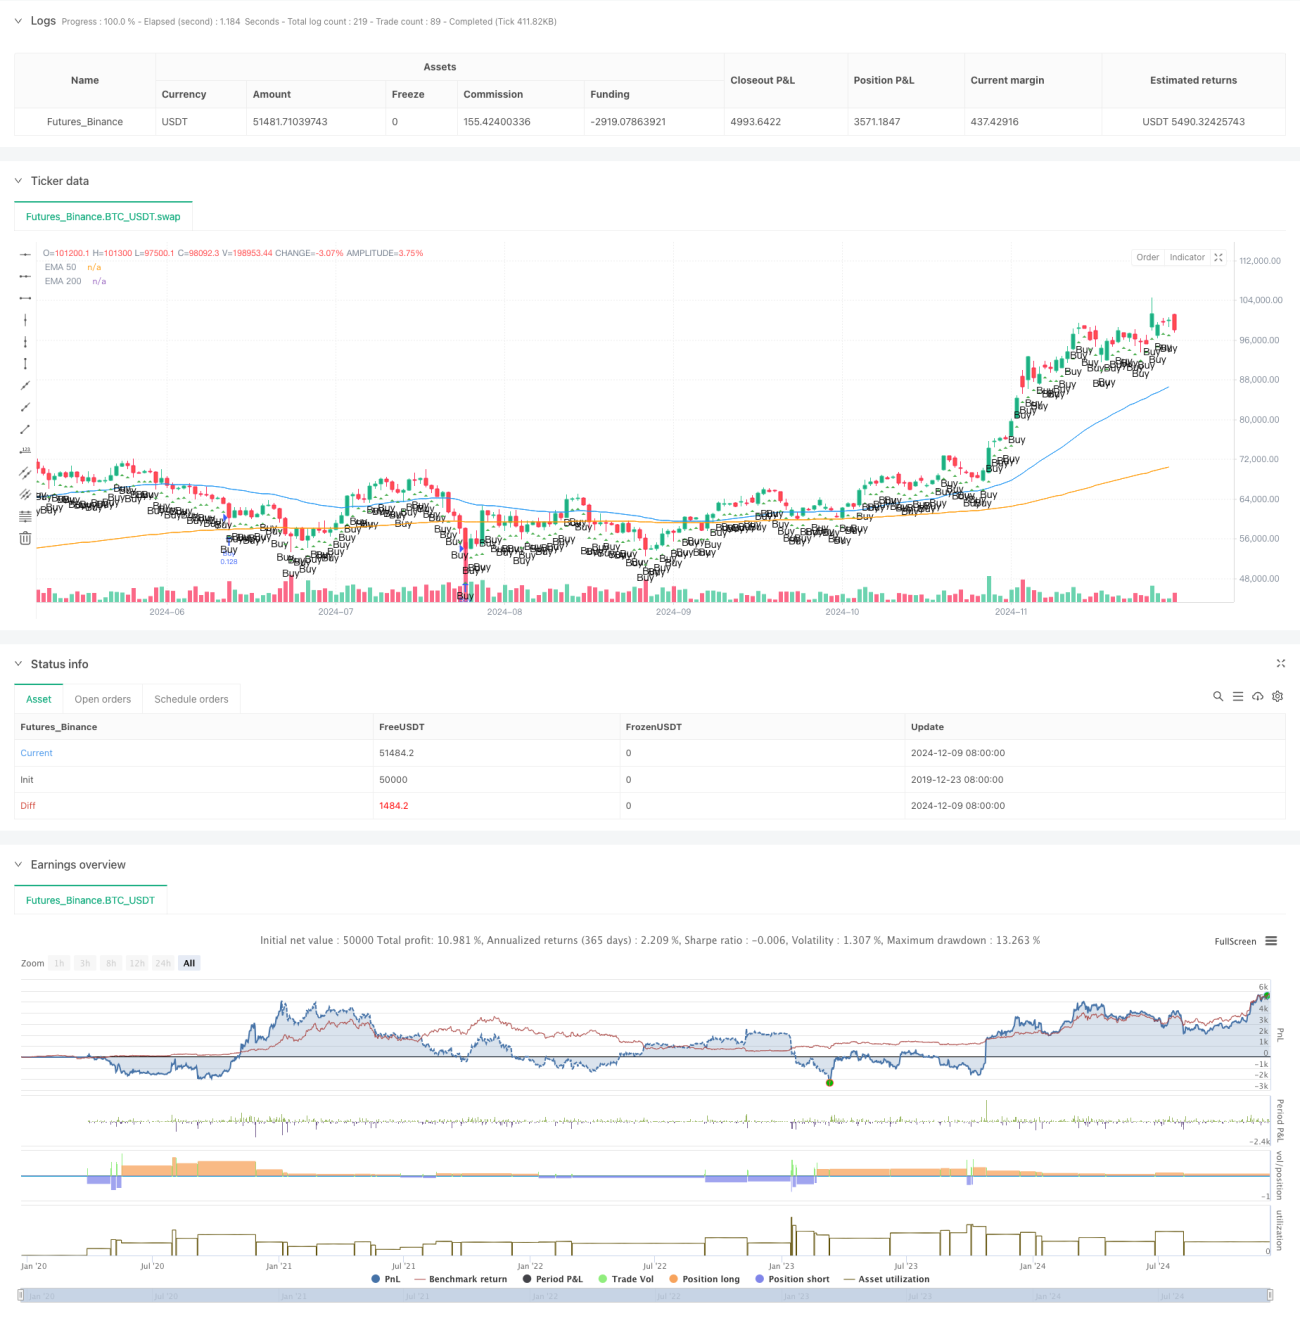
Đây là một chiến lược theo dõi xu hướng ATR động dựa trên sự phá vỡ mức hỗ trợ. Chiến lược này sử dụng hệ thống đường trung bình EMA, chỉ số biến động ATR và khái niệm tiền thông minh (SMC) để nắm bắt xu hướng thị trường. Chiến lược này thực hiện quản lý rủi ro tốt bằng cách tính toán động kích thước vị trí và vị trí dừng lỗ.
Nguyên tắc chiến lược
Chiến lược được xây dựng dựa trên một số thành phần cốt lõi:
- Sử dụng hệ thống đường trung bình EMA 50 và 200 chu kỳ để xác nhận hướng xu hướng của thị trường
- Sử dụng chỉ số ATR để điều chỉnh các mục tiêu dừng lỗ và lợi nhuận
- Tìm điểm nhập cảnh tốt nhất bằng cách phân tích khối lệnh và vùng không cân bằng
- Tính toán tự động số lượng đặt hàng dựa trên tỷ lệ rủi ro của tài khoản
- Xác định thị trường đang trong trạng thái cân bằng bằng cách quan sát phạm vi biến động của gần 20 đường K
Lợi thế chiến lược
- Quản lý rủi ro tốt, đảm bảo rủi ro của mỗi giao dịch có thể kiểm soát được thông qua tính toán động
- Hệ thống đánh giá xu hướng đáng tin cậy, tránh giao dịch trong thị trường.
- Cài đặt Stop Loss là hợp lý, tỷ lệ lợi nhuận rủi ro là 1: 3
- Đánh giá đầy đủ sự biến động của thị trường và thích ứng với các môi trường khác nhau
- Cấu trúc mã rõ ràng, dễ bảo trì và tối ưu hóa
Rủi ro chiến lược
- Chỉ số EMA có tính chậm trễ, có thể gây ra sự chậm trễ trong thời gian nhập cảnh
- Có thể kích hoạt tín hiệu sai trong thị trường biến động mạnh
- Chiến lược phụ thuộc vào sự bền vững của xu hướng, có thể không hoạt động tốt trong thị trường chấn động
- Vị trí dừng lỗ rộng hơn, trong một số trường hợp có thể chịu tổn thất lớn hơn
Hướng tối ưu hóa chiến lược
- Có thể đưa vào phân tích quan hệ giá trị và số lượng để cải thiện tính chính xác của xu hướng.
- Có thể tăng chỉ số cảm xúc thị trường, tối ưu hóa thời gian nhập cảnh
- Xem xét thêm phân tích chu kỳ thời gian đa dạng để tăng sự ổn định của hệ thống
- Các tiêu chuẩn đánh giá có thể tinh chỉnh khối đặt hàng và khu vực mất cân bằng
- Tối ưu hóa phương thức dừng lỗ, xem xét việc sử dụng dừng lỗ di động
Tóm tắt
Chiến lược này là một hệ thống theo dõi xu hướng hoàn chỉnh hơn, tăng sự ổn định của giao dịch thông qua quản lý rủi ro hợp lý và xác nhận nhiều tín hiệu. Mặc dù có một số chậm trễ, nhưng nói chung là một hệ thống giao dịch đáng tin cậy.
Source
Pine
/*backtest
start: 2019-12-23 08:00:00
end: 2024-12-10 08:00:00
period: 1d
basePeriod: 1d
exchanges: [{"eid":"Futures_Binance","currency":"BTC_USDT"}]
*/

// TradingView Pine Script strategy for Smart Money Concept (SMC)
//@version=5
strategy("Smart Money Concept Strategy", overlay=true, default_qty_type=strategy.fixed, default_qty_value=100)
Strategy parameters
Related strategies
Comment
All comments (0)
No data
- 1