Chiến lược giao dịch theo xu hướng giá cân bằng nhiều lần và đảo ngược

ATR SL TP
Ngày tạo: 2024-12-13 10:23:12 sửa đổi lần cuối: 2024-12-13 10:23:12
sao chép: 0 Số nhấp chuột: 364
1
tập trung vào
1617
Người theo dõi

Chiến lược giao dịch theo xu hướng giá cân bằng nhiều lần và đảo ngược

Tổng quan về chiến lược

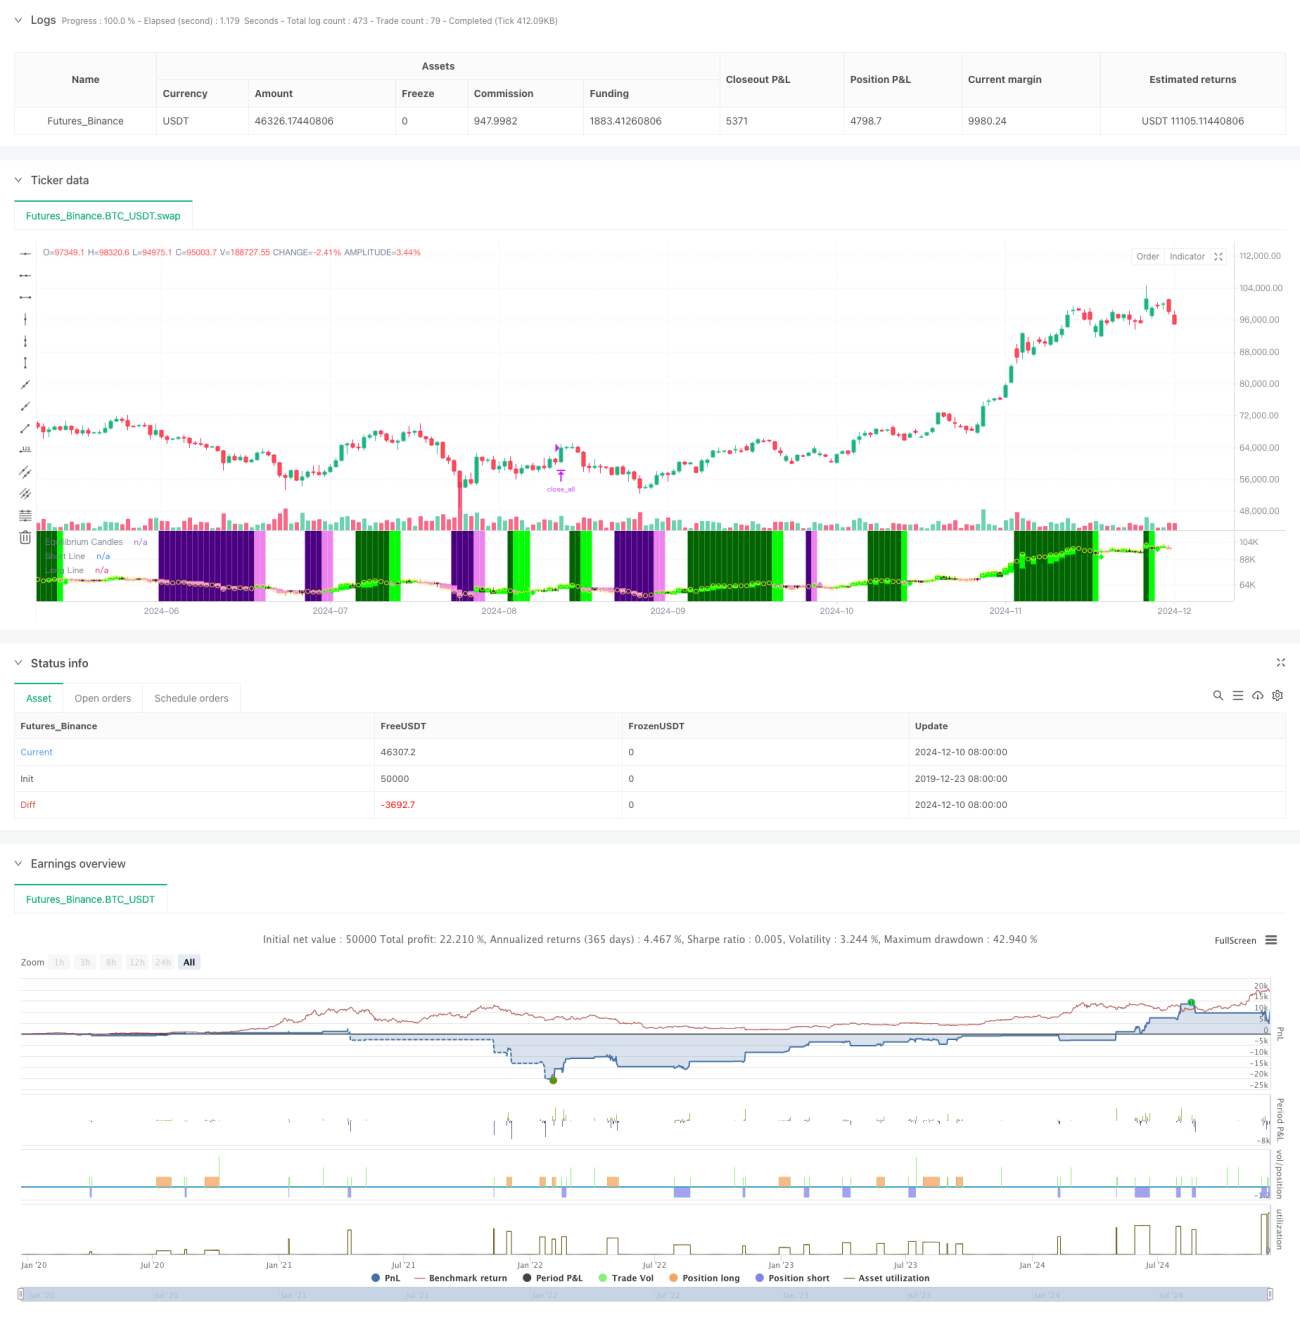
Chiến lược này là một hệ thống giao dịch theo dõi và đảo ngược xu hướng dựa trên điểm cân bằng giá. Nó xác định giá cân bằng bằng cách tính trung bình của điểm cao nhất và điểm thấp nhất của đường K gốc X trong quá khứ và đánh giá hướng xu hướng dựa trên vị trí của giá đóng cửa so với giá cân bằng.

Nguyên tắc chiến lược

  1. Tính toán giá cân bằng: Sử dụng điểm trung của giá cao nhất và giá thấp nhất của đường X gốc K trong quá khứ làm giá cân bằng, giống như cách tính toán đường chuẩn trên biểu đồ cân bằng.
  2. Xác định xu hướng: Khi giá liên tục duy trì X-phần K của cùng một bên của giá cân bằng (đường 7 gốc mặc định), nó được xác định là xu hướng.
  3. Tín hiệu nhập: kích hoạt tín hiệu nhập khi khúc đệm đầu tiên sau khi xu hướng được thiết lập ((giá vượt qua mức cân bằng))
  4. Hạn chế thiệt hại: Sử dụng phân số 60% của ATR để điều chỉnh động khoảng cách dừng thiệt hại, cung cấp sự linh hoạt trong việc kiểm soát rủi ro.
  5. Bảo vệ biến động lớn: Khi giá lệch khỏi điểm cân bằng vượt quá ATR được thiết lập, hệ thống sẽ tự động xóa vị thế để ngăn chặn sự rút lui mạnh mẽ.

Lợi thế chiến lược

  1. Khả năng thích ứng: Có thể chuyển đổi theo xu hướng và đảo ngược mô hình giao dịch tùy theo đặc điểm của thị trường.
  2. Kiểm soát rủi ro hoàn hảo: sử dụng ATR dừng động và có cơ chế bảo vệ biến động lớn.
  3. Hoạt động rõ ràng: tín hiệu giao dịch rõ ràng, không phụ thuộc vào các chỉ số kỹ thuật phức tạp.
  4. Hiệu quả trực quan tốt: sử dụng màu K-line và nền để hiển thị thị trường trực quan.
  5. Tự động hóa thân thiện: có thể dễ dàng kết nối với các nền tảng giao dịch như MT5 để thực hiện giao dịch tự động.

Rủi ro chiến lược

  1. Rủi ro thị trường chấn động: Các tín hiệu giả có thể xảy ra thường xuyên trong thị trường chấn động ngang.
  2. Ảnh hưởng của điểm trượt: Có thể có điểm trượt lớn hơn khi dao động mạnh.
  3. Tính nhạy cảm của các tham số: Các tham số cốt lõi như chu kỳ cân bằng, chu kỳ đánh giá xu hướng và nhiều thứ khác cần được tối ưu hóa cẩn thận cho các thị trường khác nhau.
  4. Rủi ro chuyển đổi thị trường: Thời kỳ chuyển đổi thị trường từ xu hướng sang biến động có thể gây ra sự rút lui lớn.

Hướng tối ưu hóa chiến lược

  1. Nhận biết môi trường thị trường: thêm mô-đun phán đoán môi trường thị trường, thay đổi các tham số chiến lược theo điều kiện thị trường khác nhau.
  2. Chọn lọc tín hiệu: Xem xét thêm các chỉ số phụ trợ như số lượng giao thông, tỷ lệ dao động để lọc tín hiệu giả.
  3. Quản lý vị trí: giới thiệu cơ chế quản lý vị trí phức tạp hơn, chẳng hạn như điều chỉnh động dựa trên tỷ lệ biến động.
  4. Nhiều chu kỳ thời gian: tích hợp các tín hiệu từ nhiều chu kỳ thời gian để tăng độ chính xác của giao dịch.
  5. Tối ưu hóa chi phí giao dịch: Tối ưu hóa các tính năng chi phí cho các loại giao dịch khác nhau.

Tóm tắt

Đây là một hệ thống giao dịch xu hướng được thiết kế hợp lý, cung cấp logic giao dịch rõ ràng thông qua khái niệm cốt lõi của giá cân bằng. Đặc điểm lớn nhất của chiến lược này là khả năng linh hoạt, có thể được sử dụng để theo dõi xu hướng và có thể được sử dụng để giao dịch đảo ngược, đồng thời có cơ chế kiểm soát rủi ro hoàn hảo. Mặc dù có thể gặp thách thức trong một số điều kiện thị trường, chiến lược này có khả năng duy trì hiệu suất ổn định trong nhiều môi trường thị trường thông qua việc tối ưu hóa liên tục và điều chỉnh linh hoạt.

Mã nguồn chiến lược
/*backtest
start: 2019-12-23 08:00:00
end: 2024-12-11 08:00:00
period: 1d
basePeriod: 1d
exchanges: [{"eid":"Futures_Binance","currency":"BTC_USDT"}]
*/

// This Pine Script™ code is subject to the terms of the Mozilla Public License 2.0 at https://mozilla.org/MPL/2.0/
// © Honestcowboy

//@version=5
strategy("Equilibrium Candles + Pattern [Honestcowboy]", overlay=false)

// ================================== //
// ---------> User Input <----------- //
// ================================== //

candleSmoothing = input.int(9, title="Equilibrium Length", tooltip="The lookback for finding equilibrium.\nIt is same calculation as the Baseline in Ichimoku Cloud and is the mid point between highest and lowest value over this length.", group="Base Settings")
candlesForTrend = input.int(7, title="Candles needed for Trend", tooltip="The amount of candles in one direction (colored) before it's considered a trend.\nOrders get created on the first candle in opposite direction.", group="Base Settings")
maxPullbackCandles = input.int(2, title="Max Pullback (candles)", tooltip="The amount of candles can go in opposite direction until a pending trade order is cancelled.", group="Base Settings")
candle_bull_c1 = input.color(color.rgb(0,255,0), title="", inline="1", group="Candle Coloring")
candle_bull_c2 = input.color(color.rgb(0,100,0), title="", inline="1", group="Candle Coloring")
candle_bear_c1 = input.color(color.rgb(238,130,238), title="", inline="2", group="Candle Coloring")
candle_bear_c2 = input.color(color.rgb(75,0,130), title="", inline="2", group="Candle Coloring")
highlightClosePrices = input.bool(defval=true, title="Highlight close prices", group="Candle Coloring", tooltip="Will put small yellow dots where closing price would be.")
useBgColoring = input.bool(defval=true, title="color main chart Bg based on trend and entry point", tooltip="colors main chart background based on trend and entry points", group="Chart Background")
trend_bull_c = input.color(color.rgb(0,100,0,50), title="Trend Bull Color", group="Chart Background")
trend_bear_c = input.color(color.rgb(75,0,130, 50), title="Trend Bear Color", group="Chart Background")
long_zone_c = input.color(color.rgb(0,255,0,60), title="Long Entry Zone Color", group="Chart Background")
short_zone_c = input.color(color.rgb(238,130,238,60), title="Short Entry Zone Color", group="Chart Background")
atrLenghtScob = input.int(14, title="ATR Length", group = "Volatility Settings")
atrAverageLength = input.int(200, title="ATR percentile averages lookback", group = "Volatility Settings")
atrPercentile    = input.int(60, minval=0, maxval=99, title="ATR > bottom X percentile", group = "Volatility Settings", tooltip="For the Final ATR value in which percentile of last X bars does it need to be a number. At 60 it's the lowest ATR in top 40% of ATR over X bars")
useReverse = input.bool(true, title="Use Reverse", group="Strategy Inputs", tooltip="The Strategy will open short orders where normal strategy would open long orders. It will use the SL as TP and the TP as SL. So would create the exact opposite in returns as the normal strategy.")
stopMultiplier = input.float(2, title="stop+tp atr multiplier", group="Strategy Inputs")
useTPSL = input.bool(defval=true, title="use stop and TP", group="Strategy Inputs")
useBigCandleExit = input.bool(defval=true, title="Big Candle Exit", group="Strategy Inputs", inline="1", tooltip="Closes all open trades whenever price closes too far from the equilibrium")
bigCandleMultiplier = input.float(defval=1, title="Exit Multiplier", group="Strategy Inputs", inline="1", tooltip="The amount of times in ATR mean candle needs to close outside of equilibrium for it to be a big candle exit.")

tvToQPerc = input.float(defval=1, title="Trade size in Account risk %", group="Tradingview.to Connection (MT5)", tooltip="Quantity as a percentage with stop loss in the commands; the lot size is calculated based on the percentage to lose in case sl is hit. If SL is not specified, the Lot size will be calculated based on account balance.")
tvToOverrideSymbol = input.bool(defval=false, title="Override Symbol?", group="Tradingview.to Connection (MT5)")
tvToSymbol = input.string(defval="EURUSD", title="", group="Tradingview.to Connection (MT5)")
// ================================== //
// -----> Immutable Constants <------ //
// ================================== // 

var bool isBullTrend = false
var bool isBearTrend = false
var bool isLongCondition = false
var bool isShortCondition = false
var int bullCandleCount = 0
var int bearCandleCount = 0
var float longLine = na
var float shortLine = na

// ================================== //
// ---> Functional Declarations <---- //
// ================================== //

baseLine(len) =>
    math.avg(ta.lowest(len), ta.highest(len))

// ================================== //
// ----> Variable Calculations <----- //
// ================================== //

longSignal = false
shortSignal = false

equilibrium = baseLine(candleSmoothing)
atrEquilibrium = ta.atr(atrLenghtScob)
atrAveraged = ta.percentile_nearest_rank(atrEquilibrium, atrAverageLength, atrPercentile)
equilibriumTop  = equilibrium + atrAveraged*bigCandleMultiplier
equilibriumBottom = equilibrium - atrAveraged*bigCandleMultiplier

// ================================== //
// -----> Conditional Variables <---- //
// ================================== //
if not isBullTrend and close>equilibrium
    bullCandleCount := bullCandleCount + 1
    bearCandleCount := 0
    isBearTrend := false

if not isBearTrend and close<equilibrium
    bearCandleCount := bearCandleCount + 1
    bullCandleCount := 0
    isBullTrend := false

if bullCandleCount >= candlesForTrend
    isBullTrend := true
    isBearTrend := false
    bullCandleCount := 0
    bearCandleCount := 0
if bearCandleCount >= candlesForTrend
    isBearTrend := true
    isBullTrend := false
    bullCandleCount := 0
    bearCandleCount := 0

// ================================== //
// ------> Strategy Execution <------ //
// ================================== //

if isBullTrend[1] and close<equilibrium
    if useReverse and (not na(atrAveraged))
        strategy.entry("short", strategy.short, limit=high)
        alert("Sell " + str.tostring((tvToOverrideSymbol ? tvToSymbol : syminfo.ticker)) + " Q=" + str.tostring(tvToQPerc) + "% P=" + str.tostring(high) + " TP=" + str.tostring(high-stopMultiplier*atrAveraged)+ " SL=" + str.tostring(high+stopMultiplier*atrAveraged), freq=alert.freq_once_per_bar)
    if (not useReverse) and (not na(atrAveraged))
        strategy.entry("long", strategy.long, stop=high)
        alert("Buy " + str.tostring((tvToOverrideSymbol ? tvToSymbol : syminfo.ticker)) + " Q=" + str.tostring(tvToQPerc) + "% P=" + str.tostring(high) + " TP=" + str.tostring(high+stopMultiplier*atrAveraged) + " SL=" + str.tostring(high+stopMultiplier*atrAveraged), freq=alert.freq_once_per_bar)
    isLongCondition := true
    isBullTrend := false
    longLine := high

if isBearTrend[1] and close>equilibrium
    if useReverse and (not na(atrAveraged))
        strategy.entry("long", strategy.long, limit=low)
        alert("Buy " + str.tostring((tvToOverrideSymbol ? tvToSymbol : syminfo.ticker)) + " Q=" + str.tostring(tvToQPerc) + "% P=" + str.tostring(low) + " TP=" + str.tostring(low+stopMultiplier*atrAveraged) + " SL=" + str.tostring(low-stopMultiplier*atrAveraged), freq=alert.freq_once_per_bar)
    if (not useReverse) and (not na(atrAveraged))
        strategy.entry("short", strategy.short, stop=low)
        alert("Sell " + str.tostring((tvToOverrideSymbol ? tvToSymbol : syminfo.ticker)) + " Q=" + str.tostring(tvToQPerc) + "% P=" + str.tostring(low) + " TP=" + str.tostring(low-stopMultiplier*atrAveraged) + " SL=" + str.tostring(low+stopMultiplier*atrAveraged), freq=alert.freq_once_per_bar)
    isShortCondition := true
    isBearTrend := false
    shortLine := low

if isLongCondition and (bearCandleCount >= maxPullbackCandles)[1]
    if useReverse
        strategy.cancel("short")
        alert("Cancel " + str.tostring((tvToOverrideSymbol ? tvToSymbol : syminfo.ticker)) + " t=sell")
    if not useReverse
        strategy.cancel("long")
        alert("Cancel " + str.tostring((tvToOverrideSymbol ? tvToSymbol : syminfo.ticker)) + " t=buy")
    isLongCondition := false
    bullCandleCount := 0
    longLine := na

if isShortCondition and (bullCandleCount >= maxPullbackCandles)[1]
    if useReverse
        strategy.cancel("long")
        alert("Cancel " + str.tostring((tvToOverrideSymbol ? tvToSymbol : syminfo.ticker)) + " t=buy")
    if not useReverse
        strategy.cancel("short")
        alert("Cancel " + str.tostring((tvToOverrideSymbol ? tvToSymbol : syminfo.ticker)) + " t=sell")
    isShortCondition := false
    bearCandleCount := 0
    shortLine := na
    
// ---- Save for graphical display that there is a longcondition + reset other variables
if high>longLine
    longSignal := true
    longLine := na
    isLongCondition := false

if low<shortLine
    shortSignal := true
    shortLine := na
    isShortCondition := false
// ---- Get Stop loss and Take Profit in there
if useReverse
    if useTPSL
        if strategy.position_size < 0 and strategy.position_size[1] >= 0
            strategy.exit("short exit", "short", limit=longLine[1]-stopMultiplier*atrAveraged, stop=longLine[1]+stopMultiplier*atrAveraged)
        if strategy.position_size > 0 and strategy.position_size[1] <= 0
            strategy.exit("long exit", "long", limit=shortLine[1]+stopMultiplier*atrAveraged, stop=shortLine[1]-stopMultiplier*atrAveraged)
if not useReverse
    if useTPSL
        if strategy.position_size > 0 and strategy.position_size[1] <= 0
            strategy.exit("long exit", "long", limit=longLine[1]+stopMultiplier*atrAveraged, stop=longLine[1]-stopMultiplier*atrAveraged)
        if strategy.position_size < 0 and strategy.position_size[1] >=0
            strategy.exit("short exit", "short", limit=shortLine[1]-stopMultiplier*atrAveraged, stop=shortLine[1]+stopMultiplier*atrAveraged)
// ----- Logic for closing positions on a big candle in either direction
if (strategy.position_size[1]>0 or strategy.position_size[1]<0) and useBigCandleExit
    if close>equilibriumTop or close<equilibriumBottom
        strategy.close_all("Big Candle Stop")
        alert("close " + str.tostring((tvToOverrideSymbol ? tvToSymbol : syminfo.ticker)))

// ================================== //
// ------> Graphical Display <------- //
// ================================== //

// Deviation from equilibrium using smoothed ATR and percentile nearest rank to rank the coloring of the candles
candle_c2 = close>equilibrium ? close>open ? candle_bull_c1 : candle_bull_c2 : close<open ? candle_bear_c1 : candle_bear_c2
// 
plotcandle(equilibrium, high, low, close, title="Equilibrium Candles", color=candle_c2, wickcolor=candle_c2, bordercolor=candle_c2)
plotshape(highlightClosePrices ? close : na, title="Closing Bubble", style=shape.circle, location=location.absolute, color=color.yellow)
bgcolor(useBgColoring ? (isBullTrend ? trend_bull_c : isBearTrend ? trend_bear_c : isLongCondition ? long_zone_c : isShortCondition ? short_zone_c : na) : na, force_overlay=true)
plot(longLine, color=candle_bull_c1, title="Long Line", style=plot.style_linebr, linewidth=4)
plot(shortLine, color=candle_bear_c1, title="Short Line", style=plot.style_linebr, linewidth=4)
plotshape(longSignal ? math.min(equilibrium, low)+(-0.5*atrAveraged) : na, title="Long Signal", color=candle_bull_c1, style=shape.diamond, size=size.tiny, location=location.absolute)
plotshape(shortSignal ? math.max(equilibrium, high)+(0.5*atrAveraged) : na, title="Short Signal", color=candle_bear_c1, style=shape.diamond, size=size.tiny, location=location.absolute)

// =================================== //
// ------> Simple Form Alerts <------- //
// =================================== //

alertcondition(longSignal, "Simple Long Signal")
alertcondition(shortSignal, "Simple Short Signal")