Chiến lược giao dịch theo xu hướng ngẫu nhiên trung bình động kép

Tổng quan
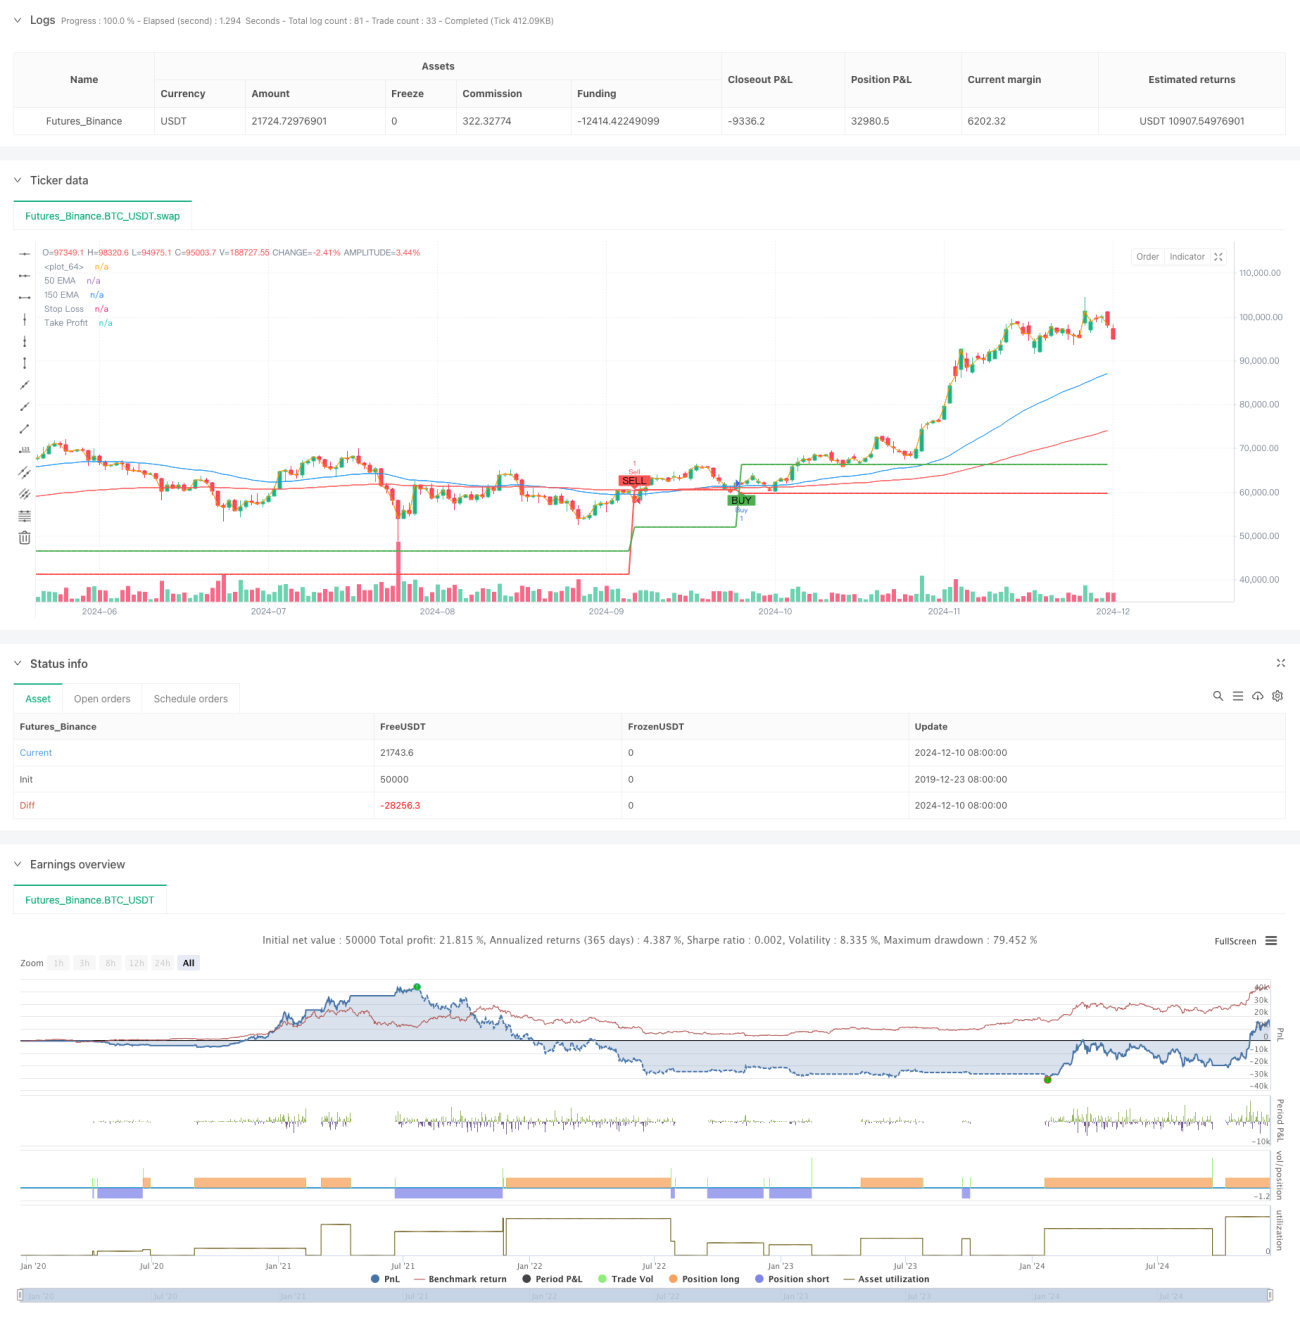
Chiến lược này là một hệ thống giao dịch theo dõi xu hướng dựa trên hai đường trung bình và các chỉ số ngẫu nhiên (Stochastic). Nó kết hợp các hệ thống trung bình để đánh giá xu hướng thị trường, đồng thời sử dụng các chỉ số ngẫu nhiên để nắm bắt các tín hiệu giao thoa trong khu vực quá mua quá bán, và thiết lập mức dừng lỗ động để kiểm soát rủi ro. Phương pháp này đảm bảo độ tin cậy của tín hiệu giao dịch và quản lý hiệu quả tỷ lệ rủi ro / lợi nhuận cho mỗi giao dịch.
Nguyên tắc chiến lược
Chiến lược này dựa trên các yếu tố cốt lõi sau:
- Sử dụng chỉ số chuyển động trung bình (EMA) 50 và 150 để xác định xu hướng thị trường
- Sử dụng chỉ số ngẫu nhiên ((14,3,3) để xác định khu vực quá mua quá bán
- Các tín hiệu chéo tìm các chỉ số ngẫu nhiên theo hướng xu hướng
- Đặt lệnh dừng động dựa trên biến động giá gần đây
- Lợi nhuận rủi ro so với thiết lập điểm dừng 1:2
Các điều kiện mua phải được đáp ứng cùng lúc:
- Giá đóng cửa cao hơn đường trung bình 50 ngày và đường trung bình 150 ngày
- Đường trung bình 50 ngày nằm trên đường trung bình 150 ngày
- Chỉ số ngẫu nhiên K thấp hơn 30 và đường K đi ngang qua đường D
Điều kiện bán là ngược lại:
- Giá đóng cửa thấp hơn đường trung bình 50 ngày và đường trung bình 150 ngày
- Đường trung bình 50 ngày nằm dưới đường trung bình 150 ngày
- Chỉ số ngẫu nhiên K cao hơn 70 và đường K đi xuống qua đường D
Lợi thế chiến lược
- Tăng độ tin cậy của hệ thống xác nhận đa dạng
- Xác định xu hướng lớn thông qua hệ thống đường trung bình
- Filter tín hiệu giả bằng chỉ số ngẫu nhiên
- Một số điều kiện cần thiết để kích hoạt tín hiệu
- Hệ thống quản lý rủi ro tốt
- Động thái dừng lỗ dựa trên kháng cự hỗ trợ gần đây
- Thu nhập rủi ro cố định so với thu nhập mong đợi tối ưu hóa
- Xu hướng xác nhận giảm nguy cơ đột phá giả
- Khả năng thích nghi cao
- Có thể áp dụng cho nhiều chu kỳ thời gian
- Các tham số có thể được điều chỉnh theo đặc điểm của thị trường
- Thích hợp với thị trường biến động cao
Rủi ro chiến lược
- Thị trường bị chấn động
- Các tín hiệu bị phá vỡ thường xuyên dẫn đến tín hiệu sai
- Khuyến nghị sử dụng khi có xu hướng rõ ràng
- Có thể thêm bộ lọc xu hướng cải thiện
- Cài đặt rủi ro dừng lỗ
- Cắt quá chặt có thể dẫn đến mất mát thường xuyên
- Hồ Chí Minh có thể chịu tổn thất lớn hơn
- Cần điều chỉnh theo biến động thị trường
- Rủi ro của sự chậm trễ
- Hệ thống trung tuyến bị tụt hậu
- Có thể bỏ lỡ điểm bắt đầu của xu hướng
- Hãy cẩn thận khi chọn thời gian vào cửa
Hướng tối ưu hóa chiến lược
- Trình lọc cường độ xu hướng tăng
- Thêm chỉ số ADX để đo cường độ của xu hướng
- Thiết lập ngưỡng cường độ xu hướng tối thiểu
- Tránh giao dịch trong xu hướng yếu
- Tối ưu hóa tham số chỉ số ngẫu nhiên
- Điều chỉnh tham số theo đặc điểm thị trường
- Cân nhắc sử dụng tham số thích ứng
- Thêm xác nhận các chỉ số kỹ thuật khác
- Cải thiện hệ thống ngăn chặn thiệt hại
- Cân nhắc sử dụng Tracking Stop Loss
- Chuyển động theo biến động
- Tối ưu hóa rủi ro / lợi nhuận thiết lập
Tóm tắt
Đây là một hệ thống chiến lược hoàn chỉnh kết hợp theo dõi xu hướng và giao dịch động lực. Bằng cách sử dụng hệ thống thống thống nhất và các chỉ số ngẫu nhiên, nó có thể đảm bảo hướng giao dịch phù hợp với xu hướng chính và giao dịch trong khu vực giá thích hợp.
- 1