
Tổng quan
Chiến lược này là một hệ thống giao dịch đột phá động lực dựa trên Bollinger Bands, chủ yếu để nắm bắt cơ hội xu hướng thông qua mối quan hệ giữa giá và Bollinger Bands. Chiến lược sử dụng cơ chế lựa chọn loại đường thẳng tự điều chỉnh, kết hợp với kênh chênh lệch chuẩn để xác định các đặc điểm biến động của thị trường, đặc biệt phù hợp để sử dụng trong môi trường thị trường biến động.
Nguyên tắc chiến lược
Logic cốt lõi của chiến lược này dựa trên các yếu tố chính sau:
- Sử dụng đường trung bình di chuyển tùy chỉnh (bao gồm SMA, EMA, SMMA, WMA, VWMA) để tính toán đường trung tâm của dải Bollinger.
- Xác định vị trí lên xuống của đường ray bằng số nhân của chênh lệch tiêu chuẩn ((tiêu chuẩn 2.0)).
- Tham gia nhiều hơn khi giá phá vỡ đường ray, cho thấy sự hình thành của xu hướng phá vỡ mạnh mẽ.
- Khi giá giảm xuống đường, bạn có thể thấy rằng xu hướng tăng đã kết thúc.
- Hệ thống có tính toán chi phí giao dịch ((0.1%) và điểm trượt ((3 điểm) để phù hợp hơn với môi trường giao dịch thực tế.
Lợi thế chiến lược
- Khả năng thích ứng: Chiến lược có thể thích ứng với các điều kiện thị trường khác nhau thông qua nhiều loại đường trung bình.
- Kiểm soát rủi ro hoàn hảo: Kiểm soát rủi ro rõ ràng được cung cấp bằng cách sử dụng đường ray dưới Bollinger làm điểm dừng lỗ.
- Quản lý tài chính hợp lý: Sử dụng phương pháp quản lý tỷ lệ vị trí, tránh rủi ro do số tiền cố định.
- Chi phí giao dịch được xem xét đầy đủ: bao gồm các khoản hoa hồng và các yếu tố điểm trượt, kết quả kiểm tra lại gần gũi hơn với thực tế.
- Khung thời gian linh hoạt: Bạn có thể chọn một khoảng thời gian giao dịch cụ thể bằng cách đặt tham số.
Rủi ro chiến lược
- Rủi ro phá vỡ giả: Có thể xảy ra các tín hiệu phá vỡ giả thường xuyên trong thị trường bất ổn.
Giải pháp: Có thể tăng các chỉ số xác nhận hoặc các cơ chế trì hoãn nhập cảnh. - Rủi ro đảo ngược xu hướng: có thể gây thiệt hại lớn khi thị trường có xu hướng mạnh đột ngột đảo ngược.
Giải pháp: Bạn có thể thêm bộ lọc cường độ xu hướng. - Độ nhạy của tham số: Các kết hợp tham số khác nhau có thể dẫn đến sự khác biệt lớn về hiệu suất chiến lược.
Giải pháp: Cần tối ưu hóa tham số đầy đủ và thử nghiệm độ bền.
Hướng tối ưu hóa chiến lược
- Các chỉ số về cường độ của xu hướng:
- Có thể thêm ADX hoặc các chỉ số tương tự để lọc tín hiệu của thị trường xu hướng yếu
- Điều này sẽ giúp giảm thiểu thiệt hại của các vụ đột phá giả.
- Tối ưu hóa hệ thống ngăn chặn thiệt hại:
- Có thể thực hiện dừng động, chẳng hạn như dừng theo dõi
- Giúp thu được lợi nhuận lớn hơn khi xu hướng tiếp tục
- Thêm bộ lọc giao dịch:
- Các tín hiệu xác nhận dựa trên số lượng giao dịch
- Tránh giao dịch trong môi trường thiếu thanh khoản
- Tốt hơn nữa là các cơ chế đăng ký:
- Các cơ chế có thể tăng cường quay trở lại
- Giúp bạn có được giá vé tốt hơn
Tóm tắt
Đây là một chiến lược theo dõi xu hướng được thiết kế hợp lý, logic rõ ràng. Nó nắm bắt động lực thị trường thông qua tính năng động của dải Bollinger và có cơ chế kiểm soát rủi ro tốt. Chiến lược có thể tùy biến mạnh mẽ, có thể thích ứng với các môi trường thị trường khác nhau thông qua điều chỉnh tham số.
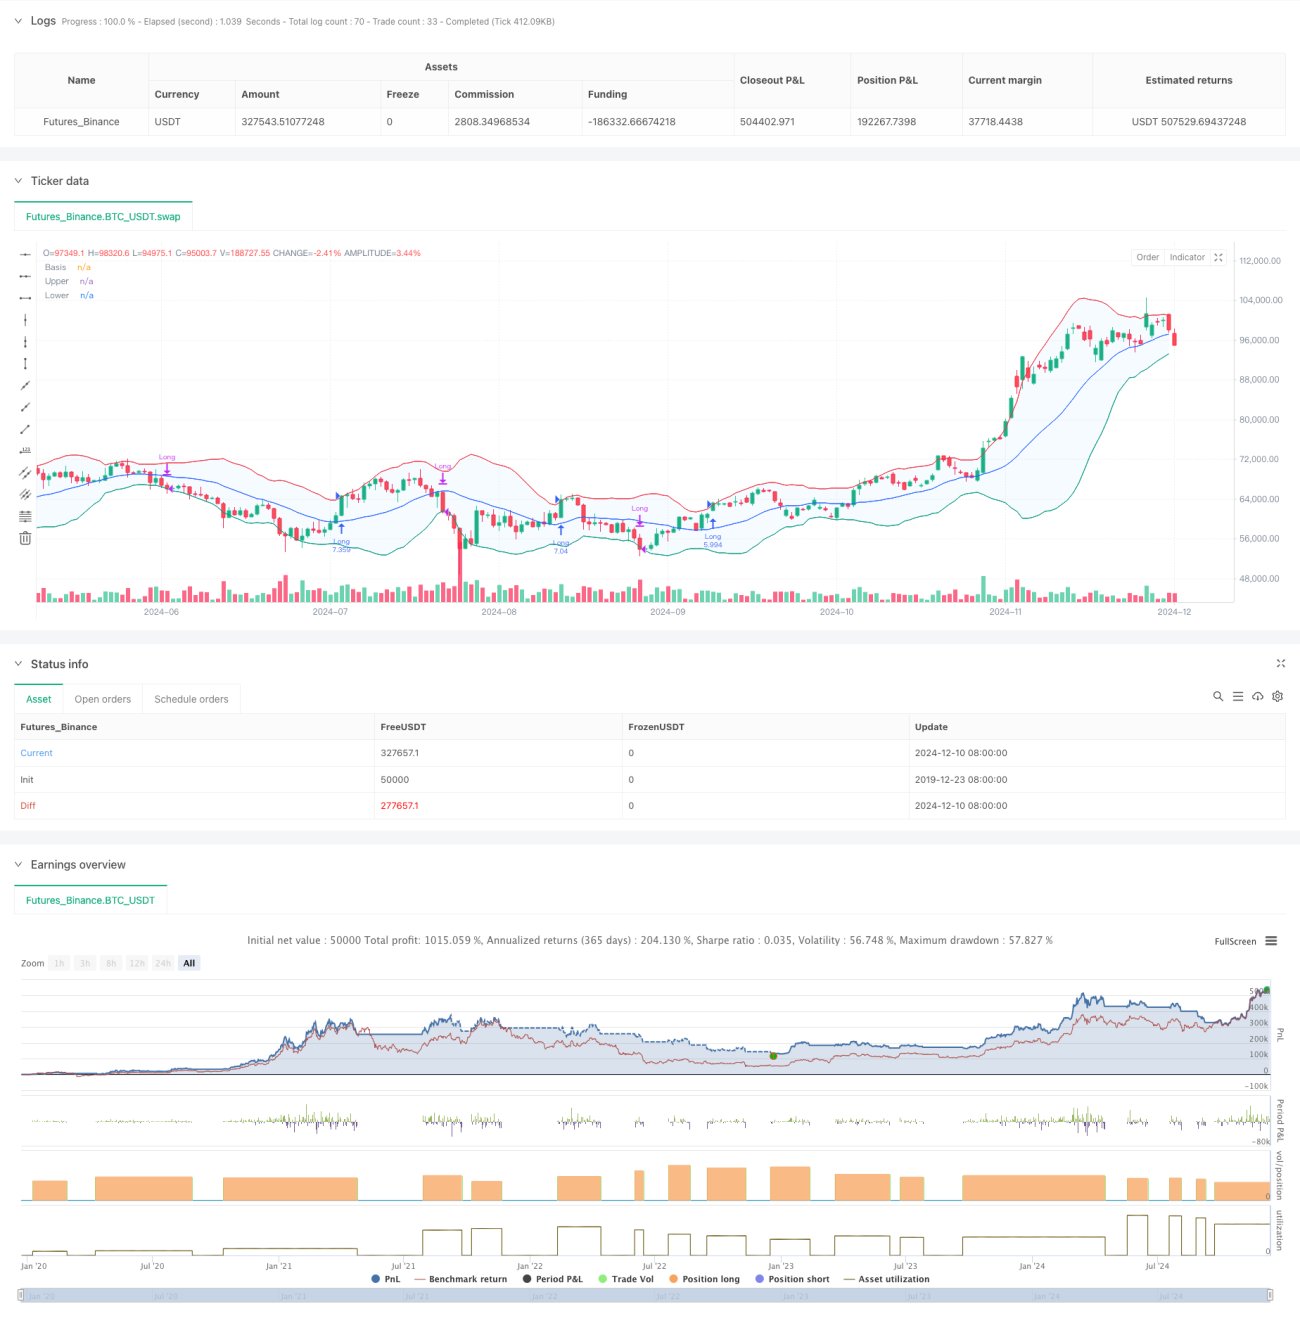
/*backtest
start: 2019-12-23 08:00:00
end: 2024-12-11 08:00:00
period: 1d
basePeriod: 1d
exchanges: [{"eid":"Futures_Binance","currency":"BTC_USDT"}]
*/

//@version=5
strategy("Demo GPT - Bollinger Bands", overlay=true, initial_capital=10000, commission_type=strategy.commission.percent, commission_value=0.1, slippage=3, default_qty_type=strategy.percent_of_equity, default_qty_value=100)

// Inputs- 1