
1
Follow
1781
Followers
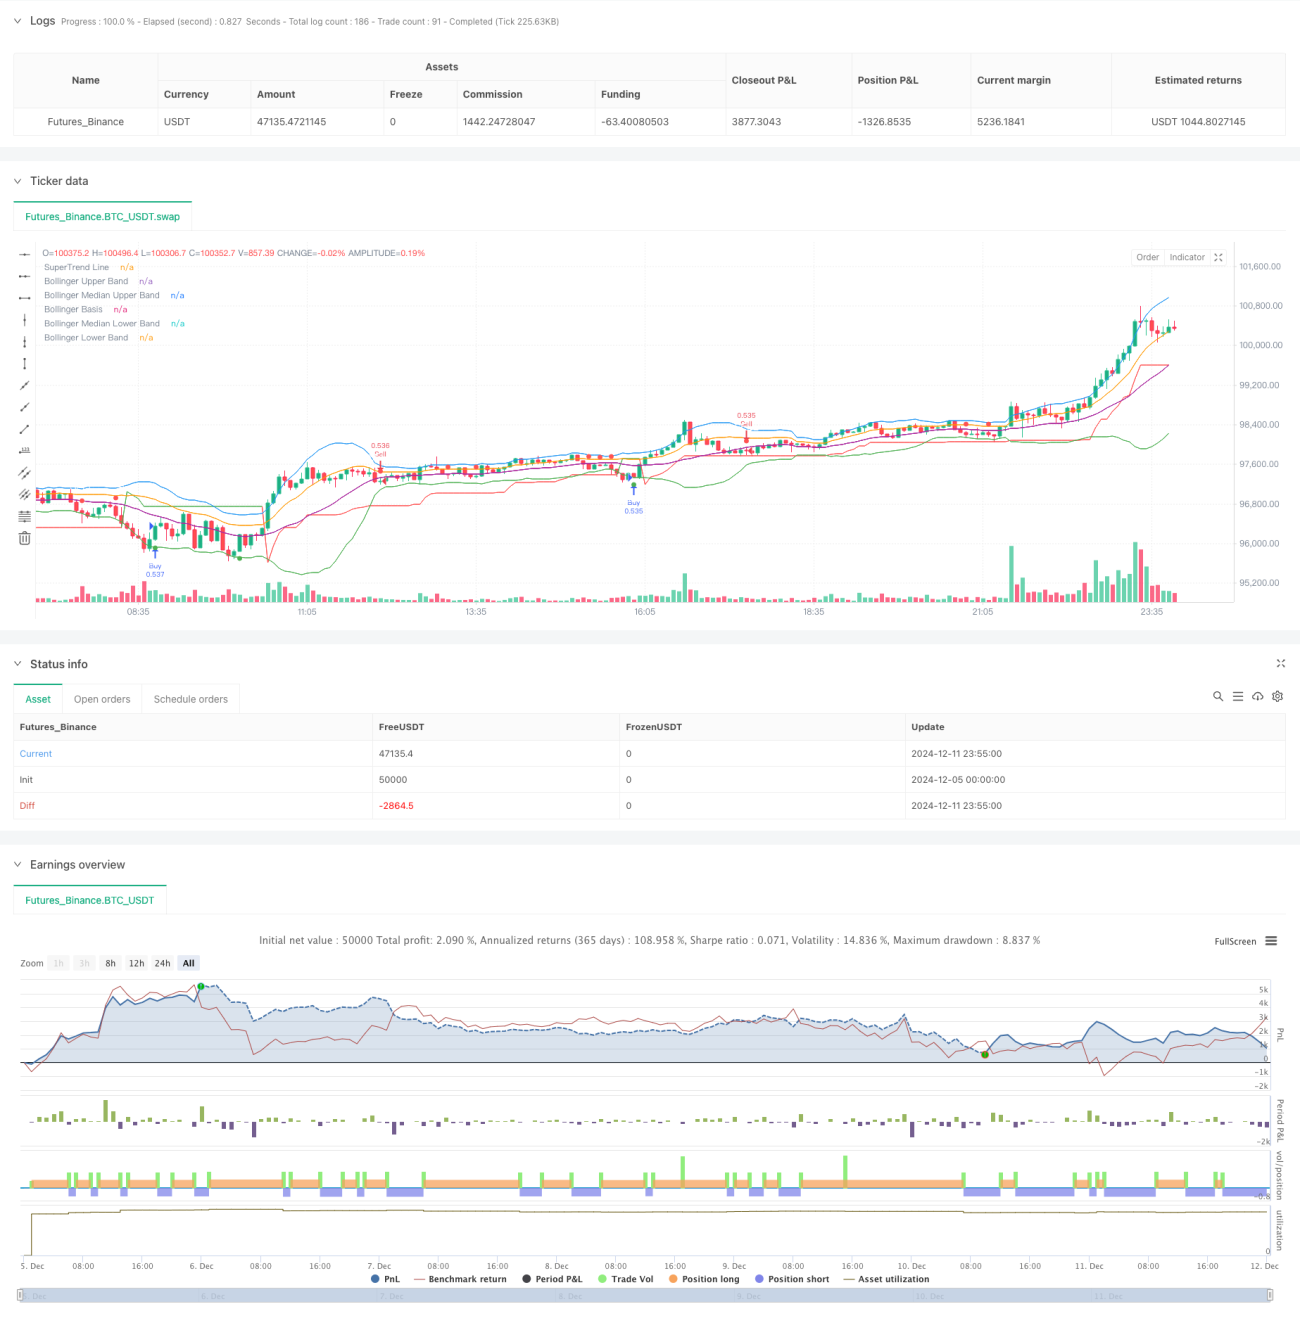
Tổng quan về chiến lược
Đây là một chiến lược giao dịch thông minh kết hợp với các chỉ số Brin và siêu xu hướng. Chiến lược này chủ yếu sử dụng Brin để xác định các khoảng dao động của thị trường, đồng thời sử dụng chỉ số siêu xu hướng để xác nhận hướng của xu hướng thị trường, do đó giao dịch ở vị trí có khả năng cao.
Nguyên tắc chiến lược
Logic cốt lõi của chiến lược này dựa trên các yếu tố chính sau:
- Sử dụng băng Brin 20 chu kỳ, băng thông là 2 chênh lệch tiêu chuẩn, xây dựng đường lên, đường giữa, đường dưới và hai đường trung tâm
- Chỉ số siêu xu hướng sử dụng ATR 10 chu kỳ và nhân 3 lần
- Tín hiệu nhập cảnh:
- Multi-headed entry: khi giá chạm đường xuống của Bollinger Bands và chỉ số siêu xu hướng là đa đầu
- Bước vào đầu: Khi giá chạm vào đường ray của Brin và chỉ số xu hướng siêu là hướng đầu
- Tín hiệu xuất phát:
- Bắt đầu nhiều đầu: Khi giá đóng cửa vượt quá đường xu hướng siêu và xu hướng chuyển sang không đầu
- Đi đầu không: Khi giá đóng cửa vượt qua đường xu hướng siêu và xu hướng chuyển sang đa đầu
Lợi thế chiến lược
- Cơ chế xác nhận kép tăng độ tin cậy giao dịch: kết hợp phạm vi biến động của Brin và định hướng của xu hướng siêu, giảm hiệu quả nguy cơ phá vỡ giả
- Tự thích ứng với biến động thị trường: Brinband tự động điều chỉnh băng thông theo biến động thị trường, giúp chiến lược có khả năng thích ứng tốt
- Tín hiệu giao dịch rõ ràng: Điều kiện nhập và thoát rõ ràng, dễ thực hiện và phản hồi
- Cài đặt tham số linh hoạt: có thể điều chỉnh chiều dài băng tần Brin, băng tần nhân và tham số siêu xu hướng theo các điều kiện thị trường khác nhau
- Hiệu quả trực quan tuyệt vời: sử dụng các tín hiệu giao dịch được đánh dấu bằng các màu sắc và hình dạng khác nhau để phân tích và giám sát dễ dàng
Rủi ro chiến lược
- Rủi ro thị trường chấn động: có thể tạo ra các tín hiệu sai lệch thường xuyên trong tình huống chấn động ngang
- Rủi ro bị tụt hậu: Brin và siêu xu hướng đều là các chỉ số bị tụt hậu, có thể bỏ lỡ điểm vào tốt nhất trong quá trình nhanh chóng
- Độ nhạy tham số: Các thiết lập tham số khác nhau có thể dẫn đến sự khác biệt lớn về hiệu suất chiến lược
Các chiến lược được đề xuất để kiểm soát rủi ro như sau:
- Thiết lập vị trí dừng lỗ để kiểm soát rủi ro đơn lẻ
- Cân nhắc tạm dừng giao dịch trong thời gian biến động mạnh
- Thường xuyên tối ưu hóa các tham số để thích ứng với sự thay đổi của thị trường
Hướng tối ưu hóa chiến lược
- Tăng bộ lọc biến động thị trường:
- Điều chỉnh kích thước vị trí trong môi trường biến động cao
- Thêm bộ lọc ATR để tránh giao dịch trong thời gian biến động quá mức
- Tăng cường hệ thống ngăn chặn:
- Cài đặt vị trí dừng lỗ động dựa trên băng thông Brin
- Chiến lược dừng động thiết kế kết hợp với độ dốc siêu xu hướng
- Thêm bộ lọc thời gian:
- Tránh thời gian công bố dữ liệu quan trọng
- Thiết lập các tham số khác nhau cho các khoảng thời gian khác nhau
- Tối ưu hóa cơ chế xác nhận tín hiệu:
- Tăng xác nhận âm lượng
- Cân nhắc tăng chỉ số cường độ xu hướng
Tóm tắt
Đây là một hệ thống giao dịch hoàn chỉnh kết hợp các chỉ số cổ điển của phân tích kỹ thuật, có thể hoạt động tốt trong cả xu hướng và biến động thông qua sự phối hợp của các đường dây Brin và xu hướng siêu. Thiết kế trực quan của chiến lược và tính linh hoạt của tham số làm cho nó có tính thực tế tốt.
Source
Pine
/*backtest
start: 2024-12-05 00:00:00
end: 2024-12-12 00:00:00
period: 5m
basePeriod: 5m
exchanges: [{"eid":"Futures_Binance","currency":"BTC_USDT"}]
*/

//@version=5
strategy("Bollinger Band & SuperTrend Strategy (Standard Chart)", overlay=true, default_qty_type=strategy.percent_of_equity, default_qty_value=100)

// Bollinger Bands SettingsStrategy parameters
Related strategies
Comment
All comments (0)
No data
- 1