Chiến lược theo dõi động lượng giao cắt đường trung bình động và độ biến động của Black Swan

Tổng quan
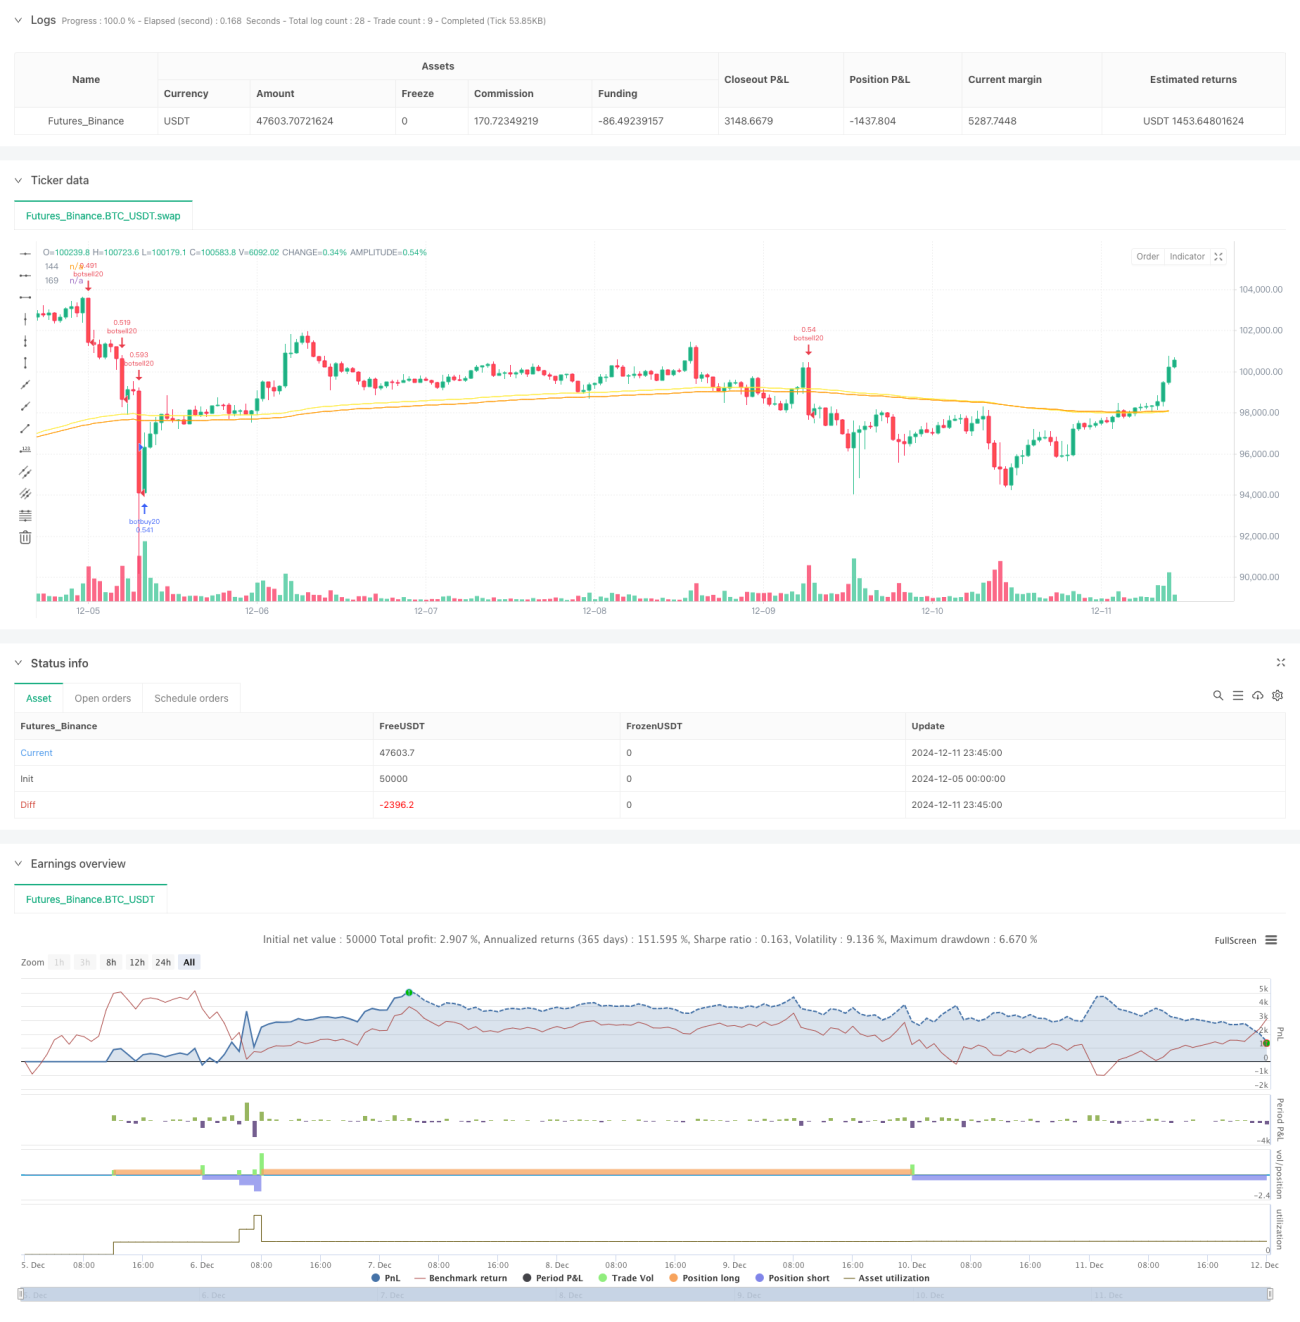
Chiến lược này là một hệ thống giao dịch theo dõi động lực dựa trên độ dao động của giá và sự giao thoa của đường trung bình. Chiến lược chủ yếu kích hoạt tín hiệu bằng cách giám sát sự biến động bất thường của tỷ lệ biến động giá vượt quá 1,91% (sự kiện Black Swan), đồng thời kết hợp với giao thoa của EMA144 và EMA169 để xác nhận hướng xu hướng và thời gian thoát.
Nguyên tắc chiến lược
Chiến lược này bao gồm hai phần chính:
- Theo dõi tỷ lệ biến động: đo lường biến động giá bằng cách tính toán chênh lệch tuyệt đối giữa giá đóng cửa và giá mở cửa so với tỷ lệ của giá đóng cửa, kích hoạt tín hiệu giao dịch khi tỷ lệ vượt quá 1,91%
- Xác định xu hướng: sử dụng giao chéo của EMA144 và EMA169 để xác nhận hướng xu hướng, giao chéo lên làm nhiều, giao chéo xuống làm trống. Ngoài ra, SMA60 và SMA20 cũng được giới thiệu như là các chỉ số hỗ trợ.
Chiến lược được thực hiện khi phát hiện biến động lên cao lớn hơn 1,91% và được thực hiện khi phát hiện biến động xuống thấp. Khi đường trung bình bị đảo ngược, chiến lược sẽ tự động thanh toán để kiểm soát rủi ro.
Lợi thế chiến lược
- Phản ứng nhanh: Chiến lược này có thể bắt kịp sự biến động mạnh mẽ của thị trường, đặc biệt phù hợp cho giao dịch ngắn hạn.
- Kiểm soát rủi ro: Kiểm soát rủi ro giữ vị trí hiệu quả bằng cách giao nhau bằng đường trung bình.
- Tính linh hoạt cao: Chiến lược cho phép thiết lập phạm vi thời gian phản hồi và điều chỉnh tham số, có thể được tối ưu hóa theo các tình huống thị trường khác nhau.
- Quản lý vị trí tốt: Kiểm soát vị trí bằng tỷ lệ phần trăm giá trị tài khoản ròng và hỗ trợ tăng vị trí kim tự tháp lên đến 3 lần.
Rủi ro chiến lược
- Rủi ro phá vỡ giả: Có thể có tín hiệu giả trong thị trường biến động cao, dẫn đến giao dịch không cần thiết.
- Rủi ro bị trượt: Do chiến lược hoạt động trong một chu kỳ ngắn, có thể phải đối mặt với tổn thất trượt lớn.
- Rủi ro đảo ngược xu hướng: có thể xảy ra sự đảo ngược nhanh chóng của xu hướng sau khi biến động mạnh.
- Tính nhạy cảm của tham số: hiệu quả chiến lược nhạy cảm với các thiết lập tham số, có thể cần điều chỉnh thường xuyên trong các điều kiện thị trường khác nhau.
Hướng tối ưu hóa chiến lược
- Tiếp tục giới thiệu bộ lọc tỷ lệ dao động: Đề xuất tăng chỉ số ATR để lọc tiếng ồn thị trường và cải thiện chất lượng tín hiệu.
- Tối ưu hóa thời gian nhập học: Bạn có thể xem xét việc tăng xác nhận số lượng nhập học để cải thiện độ chính xác của nhập học.
- Các tham số điều chỉnh động: đề xuất phát triển hệ thống tham số thích ứng, tự động điều chỉnh các ngưỡng kích hoạt theo điều kiện thị trường.
- Cải thiện hệ thống dừng lỗ: đề xuất thêm tính năng theo dõi dừng lỗ để bảo vệ lợi nhuận tốt hơn.
Tóm tắt
Chiến lược này thực hiện phản ứng nhanh chóng và theo dõi xu hướng đối với biến động bất thường của thị trường bằng cách kết hợp giám sát tỷ lệ biến động và giao thoa. Chiến lược được thiết kế hợp lý, có cơ chế kiểm soát rủi ro tốt, nhưng vẫn yêu cầu các nhà giao dịch tối ưu hóa tham số và quản lý rủi ro theo tình hình thị trường thực tế.
- 1