
Tổng quan
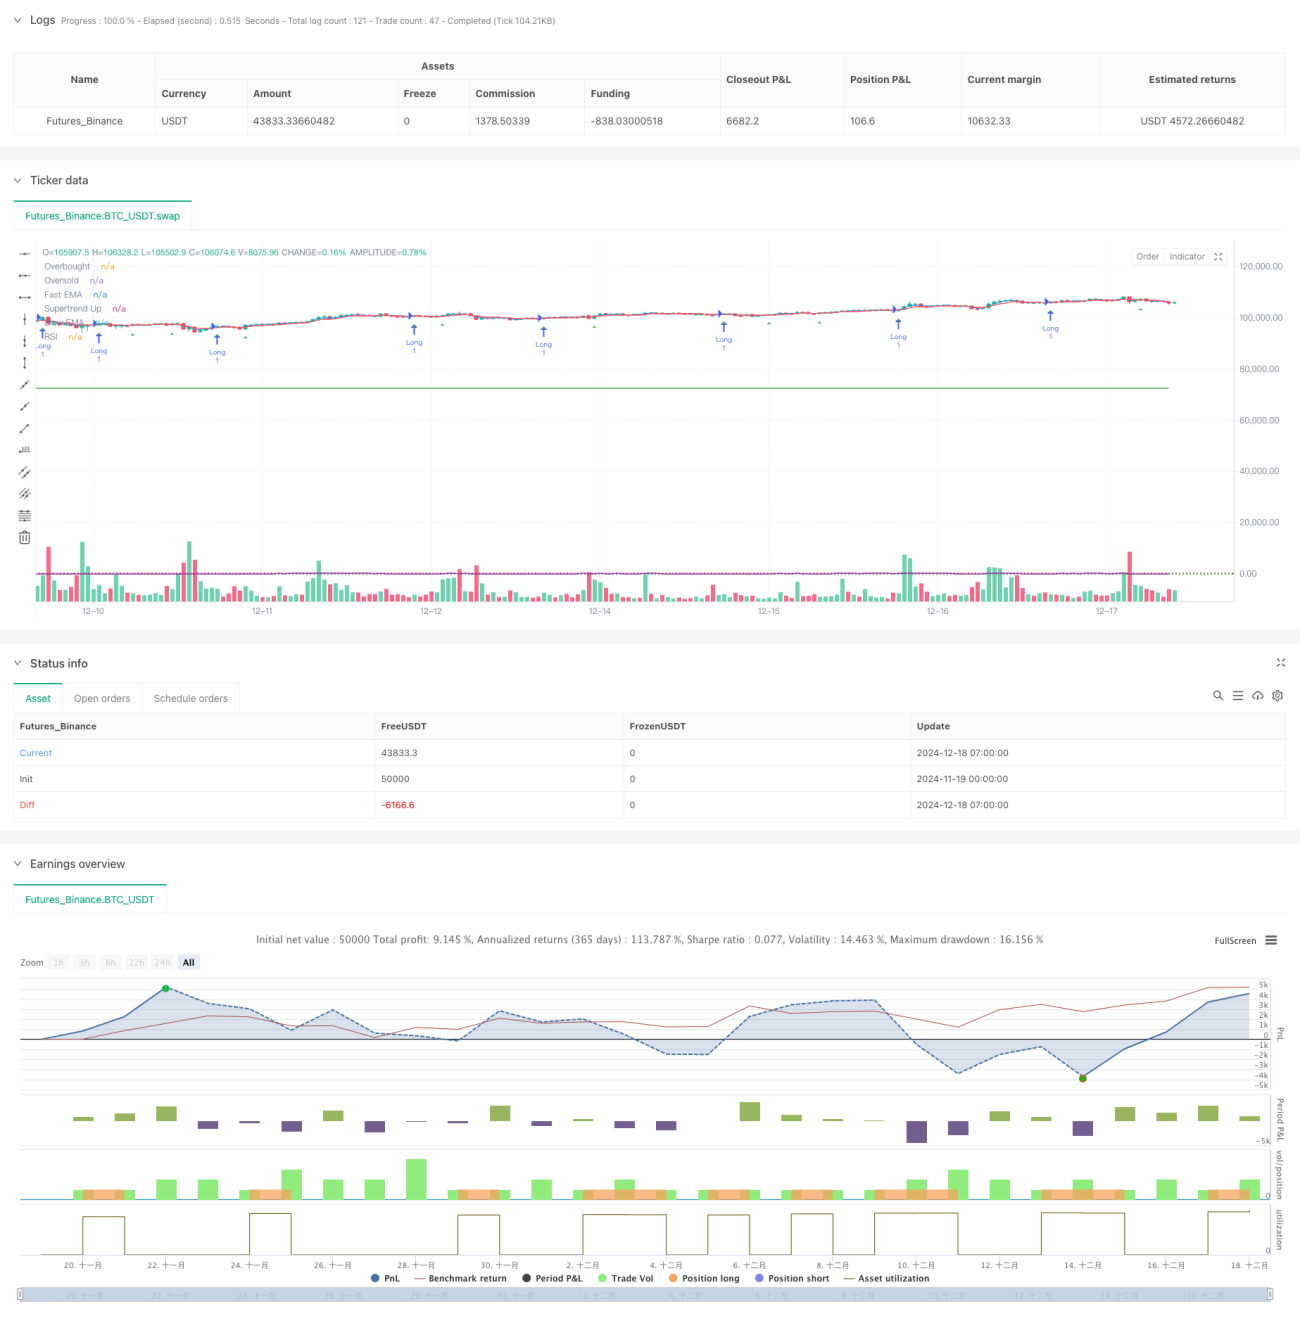
Đây là một chiến lược theo dõi xu hướng kết hợp nhiều chỉ số kỹ thuật, chủ yếu sử dụng các chỉ số di chuyển nhanh và chậm (EMA) chéo, chỉ số xu hướng Supertrend và chỉ số tương đối mạnh (RSI) để xác định các cơ hội giao dịch. Chiến lược này sử dụng sự kết hợp hữu cơ của các chỉ số để tăng bộ lọc động lực dựa trên theo dõi xu hướng, đồng thời sử dụng ATR để điều chỉnh động vị trí dừng lỗ để thực hiện một hệ thống giao dịch hoàn chỉnh.
Nguyên tắc chiến lược
Chiến lược này sử dụng một cơ chế lọc ba lần để xác định tín hiệu giao dịch:
- Hệ thống giao chéo EMA được sử dụng để nắm bắt sự thay đổi xu hướng ngắn hạn, tạo ra tín hiệu đa khi EMA nhanh vượt qua EMA chậm và tạo ra tín hiệu trống khi đi xuống.
- Chỉ số Supertrend dựa trên ATR tính toán đường hỗ trợ / kháng cự động để xác định hướng xu hướng tổng thể. Chỉ khi giá nằm trên đường Supertrend, và chỉ khi giá nằm dưới đường.
- Chỉ số RSI được sử dụng để lọc tình trạng thị trường mua hoặc bán quá mức. RSI chỉ được phép làm nhiều hơn khi nó không đạt đến vùng mua quá mức và chỉ được phép làm rỗng khi nó không đạt đến vùng bán quá mức.
Chiến lược cũng bao gồm hệ thống dừng lỗ động dựa trên ATR, có thể tự động điều chỉnh các tham số quản lý rủi ro theo biến động của thị trường. Đồng thời giới hạn thời gian giao dịch thông qua bộ lọc thời gian để tránh giao dịch trong thời gian có tính thanh khoản thấp.
Lợi thế chiến lược
- Sự kết hợp của nhiều chỉ số kỹ thuật cung cấp tín hiệu giao dịch đáng tin cậy hơn, tránh các tín hiệu sai mà chỉ số đơn lẻ có thể mang lại.
- Cài đặt dừng lỗ động có thể thích ứng với các tình trạng biến động thị trường khác nhau, cho phép giao dịch có thêm không gian thở khi biến động lớn hơn.
- Cơ chế lọc RSI có hiệu quả trong việc giảm nguy cơ tham gia vào các tình trạng cực đoan của thị trường.
- Chức năng lọc thời gian cho phép các nhà giao dịch tập trung vào các thời điểm giao dịch cụ thể, tránh giao dịch trong thời gian kém hiệu quả.
Rủi ro chiến lược
- Nhiều điều kiện lọc có thể làm mất đi một số cơ hội giao dịch tiềm năng.
- Trong một thị trường biến động nhanh chóng, mức dừng lỗ có thể dễ dàng bị chạm vào.
- Các tham số được tối ưu hóa quá mức có thể gây ra vấn đề quá phù hợp.
- Các giao dịch có tần số cao có thể dẫn đến chi phí giao dịch cao hơn.
Hướng tối ưu hóa chiến lược
- Có thể xem xét tăng chỉ số giao dịch như một xác nhận phụ trợ.
- Giới thiệu cơ chế điều chỉnh tham số thích ứng để chiến lược có thể thích ứng tốt hơn với các môi trường thị trường khác nhau.
- Thêm bộ lọc cường độ xu hướng để tránh giao dịch quá mức trong thị trường xu hướng yếu.
- Phát triển hệ thống quản lý vị thế thông minh hơn, điều chỉnh tỷ lệ giữ vị trí theo tình hình thị trường.
Tóm tắt
Chiến lược này xây dựng một hệ thống giao dịch tương đối toàn diện bằng cách kết hợp nhiều chỉ số kỹ thuật và điều kiện lọc. Điểm mạnh cốt lõi của nó là cơ chế xác nhận nhiều lần và quản lý rủi ro động, nhưng cũng cần chú ý đến các vấn đề như tối ưu hóa tham số và chi phí giao dịch.
- 1