Chiến lược định lượng bản đồ nhiệt trung tâm thanh khoản đa thời gian

Tổng quan
Chiến lược này là một hệ thống giao dịch định lượng dựa trên phát hiện các điểm trung tâm lưu động trong nhiều chu kỳ thời gian. Nó phân tích hành vi giá trong ba chu kỳ thời gian khác nhau (khoảng 15 phút, 1 giờ và 4 giờ) để xác định các mức hỗ trợ và kháng cự quan trọng và đưa ra quyết định giao dịch dựa trên đó. Hệ thống tích hợp các chức năng quản lý tiền, bao gồm cài đặt dừng lỗ với số tiền cố định, đồng thời cung cấp phản hồi trực quan trực quan để giúp thương nhân hiểu rõ hơn về cấu trúc thị trường.
Nguyên tắc chiến lược
Cốt lõi của chiến lược này là phát hiện các điểm trung tâm giá trên nhiều chu kỳ thời gian thông qua các hàm ta.pivothigh và ta.pivotlow. Đối với mỗi chu kỳ thời gian, hệ thống sử dụng các đường K tham chiếu bên trái và bên phải (được mặc định 7) để xác định các điểm cao và thấp đáng chú ý.
Lợi thế chiến lược
- Phân tích nhiều chu kỳ thời gian cung cấp cái nhìn toàn diện hơn về thị trường, giúp nắm bắt các cơ hội giao dịch ở các cấp độ khác nhau
- Logic giao dịch dựa trên hub có nền tảng phân tích kỹ thuật vững chắc, dễ hiểu và dễ thực hiện
- Tính năng quản lý tiền tích hợp có thể kiểm soát rủi ro của mỗi giao dịch một cách hiệu quả
- Giao diện trực quan hiển thị tình trạng giao dịch, bao gồm vị trí, mức dừng lỗ và vùng lỗ
- Các tham số chiến lược có thể điều chỉnh, thích ứng và có thể được tối ưu hóa theo các điều kiện thị trường khác nhau
Rủi ro chiến lược
- Các tín hiệu có nhiều chu kỳ thời gian có thể gây ra xung đột và cần thiết phải có cơ chế ưu tiên tín hiệu hợp lý
- Lệnh dừng lỗ với số tiền cố định có thể không phù hợp với tất cả các điều kiện thị trường và được đề xuất điều chỉnh theo động thái biến động
- Sự chậm trễ trong kiểm tra tại các trung tâm có thể gây ra sự chậm trễ trong thời gian nhập cảnh.
- Có thể có tín hiệu đột phá giả trong thời gian biến động mạnh
- Cần chú ý đến sự khác biệt về tính thanh khoản trong các chu kỳ thời gian khác nhau
Hướng tối ưu hóa chiến lược
- Tiến hành chỉ số biến động, động điều chỉnh mức dừng lỗ
- Thêm cơ chế xác nhận khối lượng giao dịch, nâng cao độ tin cậy của các trung tâm
- Phát triển hệ thống ưu tiên chu kỳ thời gian để giải quyết xung đột tín hiệu
- Tích hợp bộ lọc xu hướng để tránh giao dịch quá mức trên thị trường ngang
- Xem xét thêm phân tích cấu trúc giá để tăng độ chính xác của thời gian nhập cảnh
Tóm tắt
Chiến lược định lượng nhiệt độ trung tâm lưu động nhiều chu kỳ là một hệ thống giao dịch có cấu trúc, logic rõ ràng. Nó cung cấp cho các nhà giao dịch một khuôn khổ giao dịch đáng tin cậy thông qua phân tích thị trường đa chiều và quản lý rủi ro nghiêm ngặt. Mặc dù có một số rủi ro và hạn chế vốn có, nhưng thông qua việc tối ưu hóa và cải tiến liên tục, chiến lược này có khả năng duy trì hiệu suất ổn định trong nhiều môi trường thị trường.
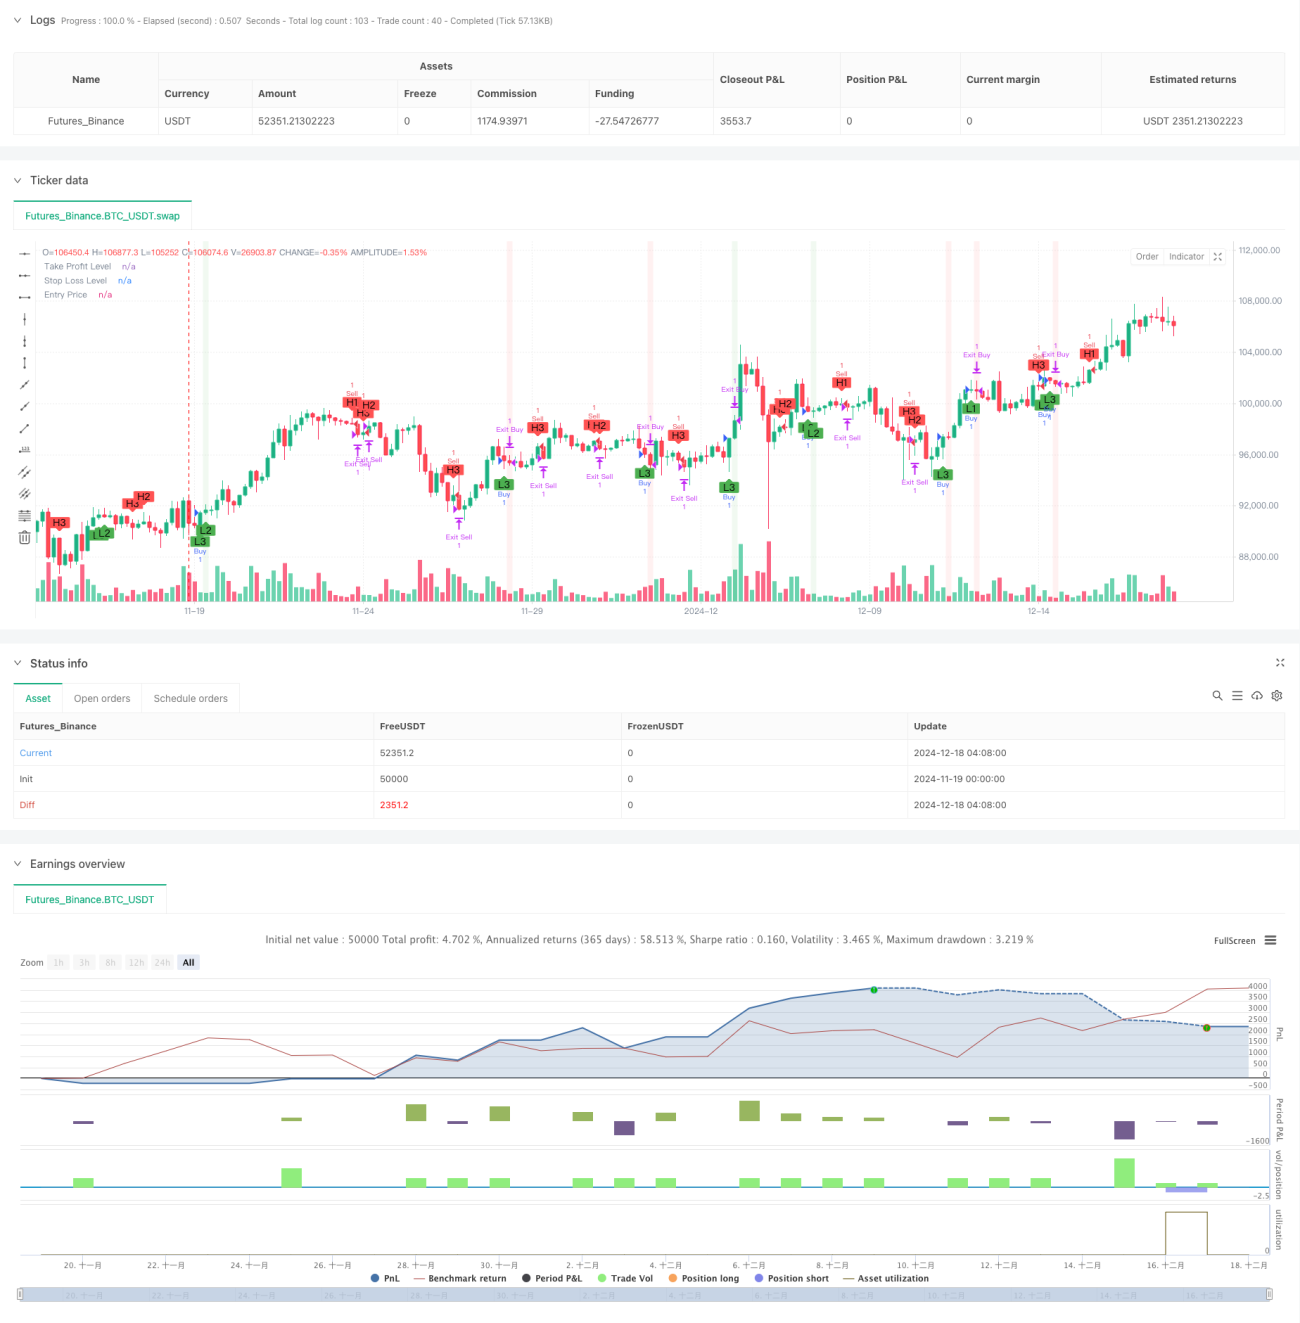
/*backtest
start: 2024-11-19 00:00:00
end: 2024-12-18 08:00:00
period: 4h
basePeriod: 4h
exchanges: [{"eid":"Futures_Binance","currency":"BTC_USDT"}]
*/

// This Pine Script™ code is subject to the terms of the Mozilla Public License 2.0 at https://mozilla.org/MPL/2.0/
// © pmotta41
//@version=5
strategy("GPT Session Liquidity Heatmap Strategy", overlay=true)- 1