
Tổng quan
Chiến lược này kết hợp Bollinger Bands và chỉ báo Supertrend ba lớp để giao dịch. Bằng cách sử dụng dải biên độ dao động của Bollinger Bands và xác nhận xu hướng từ Supertrend ba lớp, hình thành một hệ thống theo xu hướng vững chắc. Bollinger Bands được dùng để nhận biết các biến động giá cực đoan, trong khi Supertrend ba lớp cung cấp nhiều xác nhận về hướng xu hướng thông qua các cài đặt tham số khác nhau. Chỉ giao dịch khi tất cả các tín hiệu đồng nhất, nhờ đó giảm thiểu rủi ro từ tín hiệu giả. Phương pháp kết hợp này vừa giữ được ưu điểm của chiến lược theo xu hướng, vừa tăng độ tin cậy của giao dịch.
Nguyên lý chiến lược
Logic cốt lõi của chiến lược bao gồm các phần chính sau:
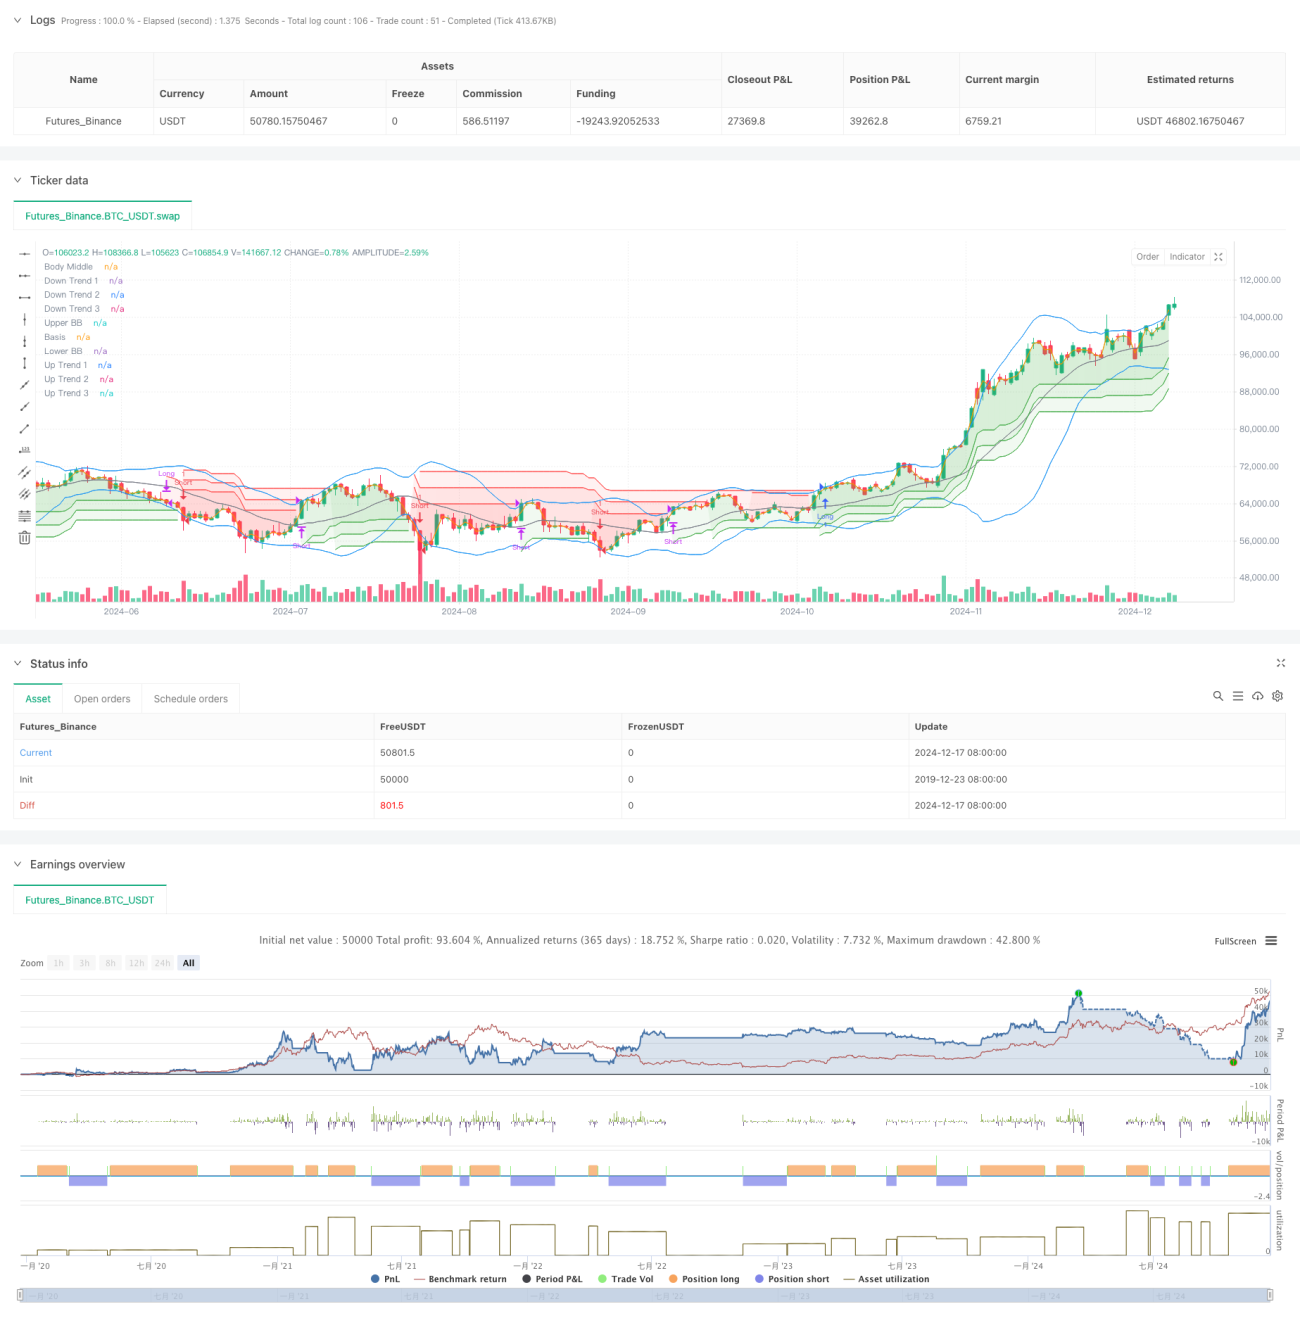
- Sử dụng Bollinger Bands chu kỳ 20, độ lệch chuẩn là 2.0, để đánh giá biến động giá.
- Thiết lập ba đường Supertrend với chu kỳ lần lượt là 10 và các tham số tương ứng là 3.0, 4.0 và 5.0.
- Điều kiện vào lệnh mua (long): Giá phá vỡ dải trên của Bollinger Bands và cả ba đường Supertrend đều hiển thị xu hướng tăng.
- Điều kiện vào lệnh bán (short): Giá phá vỡ dải dưới của Bollinger Bands và cả ba đường Supertrend đều hiển thị xu hướng giảm.
- Khi bất kỳ một đường Supertrend nào đổi hướng, đóng vị thế hiện tại.
- Sử dụng đường giá trung bình (middle price line) làm tham chiếu nền, tăng cường hiệu ứng trực quan.
Ưu điểm của chiến lược
- Cơ chế xác nhận đa lớp: Nhờ kết hợp Bollinger Bands và Supertrend ba lớp, giảm đáng kể các tín hiệu giả.
- Khả năng theo xu hướng mạnh: Các tham số tăng dần của chỉ báo Supertrend giúp nắm bắt hiệu quả các xu hướng ở nhiều cấp độ khác nhau.
- Kiểm soát rủi ro tốt: Khi xu hướng có dấu hiệu đảo chiều, nhanh chóng đóng lệnh để kiểm soát drawdown.
- Tính linh hoạt của tham số: Tất cả các tham số chỉ báo đều có thể tối ưu hóa theo đặc điểm thị trường khác nhau.
- Mức độ tự động hóa cao: Logic chiến lược rõ ràng, dễ dàng thực hiện hệ thống hóa.
Rủi ro của chiến lược
- Rủi ro thị trường dao động ngang: Trong thị trường đi ngang, có thể phát sinh nhiều tín hiệu đột phá giả.
- Ảnh hưởng của trượt giá (slippage): Trong giai đoạn biến động mạnh, có thể đối mặt với tổn thất trượt giá lớn.
- Rủi ro chậm trễ: Cơ chế xác nhận đa lớp có thể khiến thời điểm vào lệnh bị trễ.
- Độ nhạy của tham số: Các bộ tham số khác nhau có thể dẫn đến sự khác biệt lớn về hiệu suất chiến lược.
- Phụ thuộc vào môi trường thị trường: Chiến lược hoạt động tốt hơn trong thị trường có xu hướng rõ ràng.
Hướng tối ưu hóa chiến lược
- Đưa chỉ báo khối lượng vào: Sử dụng khối lượng giao dịch để xác nhận tính hiệu quả của sự đột phá giá.
- Tối ưu cơ chế dừng lỗ: Có thể thêm dừng lỗ di động hoặc dừng lỗ động dựa trên ATR.
- Thêm bộ lọc thời gian: Cấm giao dịch trong các khoảng thời gian nhất định để tránh biến động kém hiệu quả.
- Thêm bộ lọc biến động: Điều chỉnh vị thế hoặc tạm dừng giao dịch trong thời kỳ biến động quá mức.
- Phát triển cơ chế tự thích ứng tham số: Điều chỉnh tham số động theo trạng thái thị trường.
Tổng kết
Đây là chiến lược theo xu hướng kết hợp Bollinger Bands và Supertrend ba lớp, nâng cao độ tin cậy giao dịch thông qua xác nhận từ nhiều chỉ báo kỹ thuật. Chiến lược có khả năng nắm bắt xu hướng và kiểm soát rủi ro tốt, nhưng cũng cần lưu ý ảnh hưởng của môi trường thị trường đến hiệu suất. Bằng cách liên tục tối ưu hóa và hoàn thiện, chiến lược có thể duy trì hiệu suất ổn định trong các điều kiện thị trường khác nhau. Khuyến nghị tiến hành backtesting đầy đủ và tối ưu hóa tham số trước khi giao dịch thực tế, đồng thời điều chỉnh phù hợp dựa trên tình hình thị trường thực tế.
//@version=5
strategy("Demo GPT - Bollinger + Triple Supertrend Combo", overlay=true, commission_type=strategy.commission.percent, commission_value=0.1, slippage=3)

// -------------------------------
// User Input for Date Range
// -------------------------------
startDate = input(title="Start Date", defval=timestamp("2018-01-01 00:00:00"))
endDate   = input(title="End Date",   defval=timestamp("2069-12-31 23:59:59"))

// -------------------------------
// Bollinger Band Inputs
// -------------------------------- 1